. 2012 Nov 9:3:385.
doi: 10.3389/fmicb.2012.00385. eCollection 2012.

Identifying reference genes with stable expression from high throughput sequence data

Affiliations

Identifying reference genes with stable expression from high throughput sequence data

Harriet Alexander et al. Front Microbiol. .

Abstract

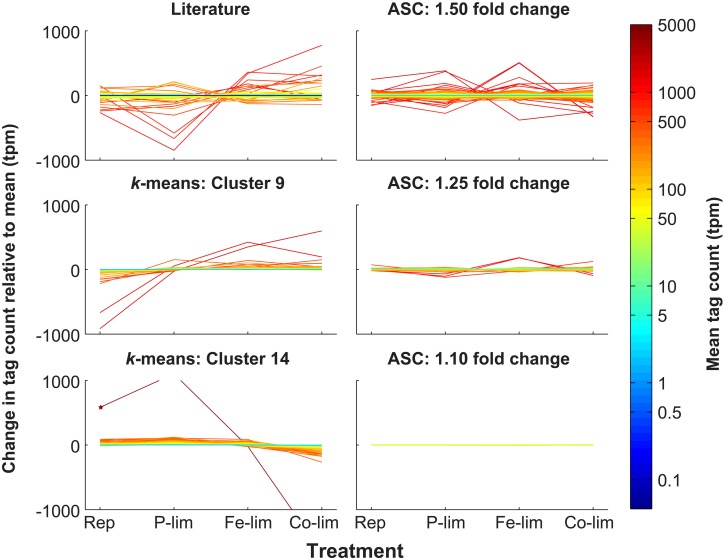
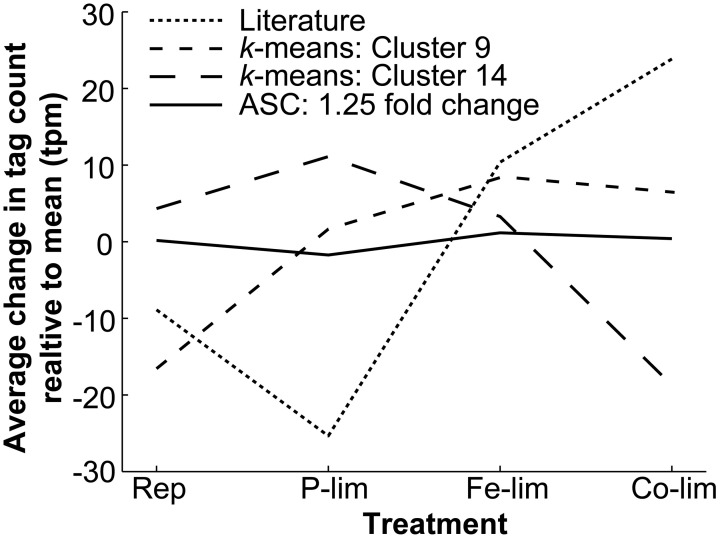
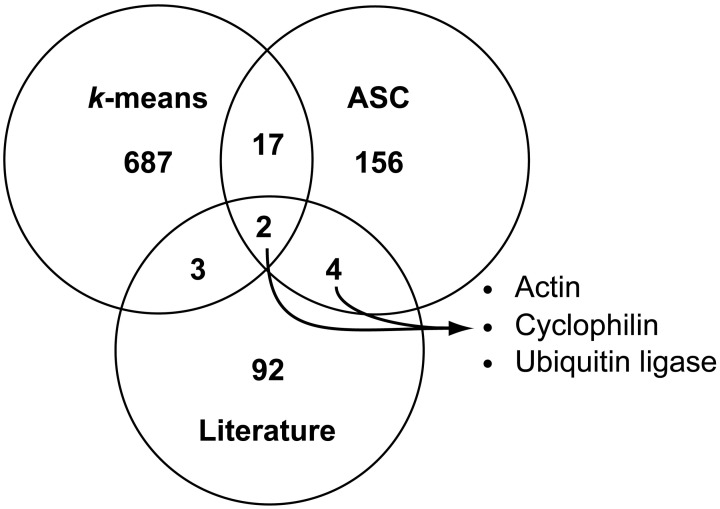
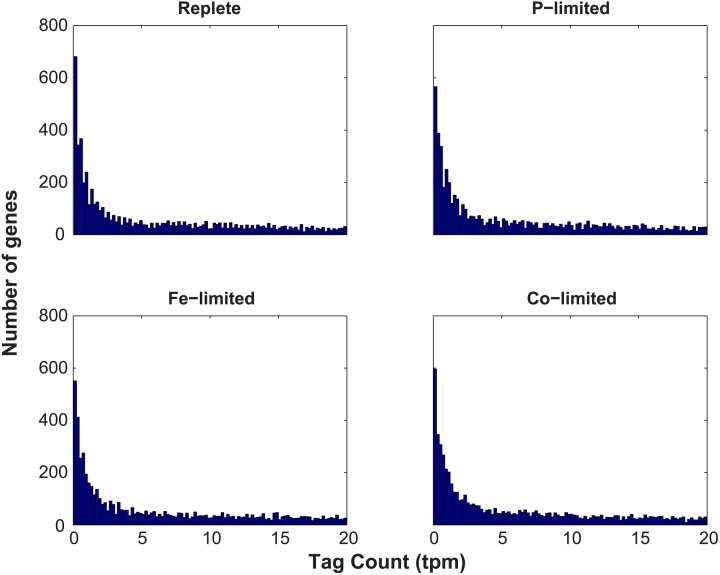
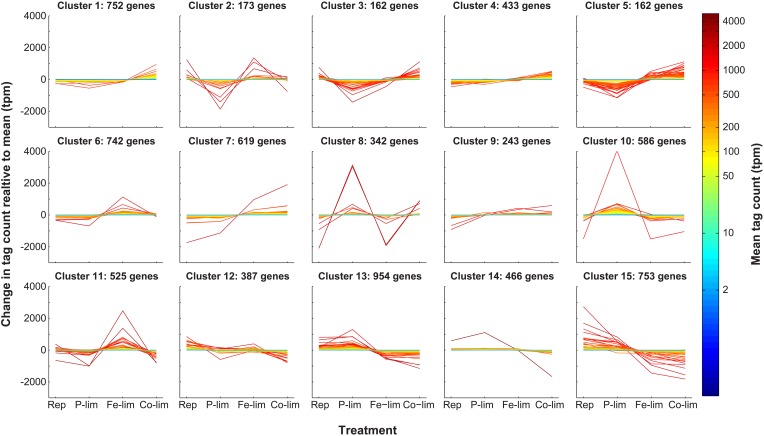
Genes that are constitutively expressed across multiple environmental stimuli are crucial to quantifying differentially expressed genes, particularly when employing quantitative reverse transcriptase polymerase chain reaction (RT-qPCR) assays. However, the identification of these potential reference genes in non-model organisms is challenging and is often guided by expression patterns in distantly related organisms. Here, transcriptome datasets from the diatom Thalassiosira pseudonana grown under replete, phosphorus-limited, iron-limited, and phosphorus and iron co-limited nutrient regimes were analyzed through literature-based searches for homologous reference genes, k-means clustering, and analysis of sequence counts (ASC) to identify putative reference genes. A total of 9759 genes were identified and screened for stable expression. Literature-based searches surveyed 18 generally accepted reference genes, revealing 101 homologs in T. pseudonana with variable expression and a wide range of mean tags per million. k-means analysis parsed the whole transcriptome into 15 clusters. The two most stable clusters contained 709 genes, but still had distinct patterns in expression. ASC analyses identified 179 genes that were stably expressed (posterior probability < 0.1 for 1.25 fold change). Genes known to have a stable expression pattern across the test treatments, like actin, were identified in this pool of 179 candidate genes. ASC can be employed on data without biological replicates and was more robust than the k-means approach in isolating genes with stable expression. The intersection of the genes identified through ASC with commonly used reference genes from the literature suggests that actin and ubiquitin ligase may be useful reference genes for T. pseudonana and potentially other diatoms. With the wealth of transcriptome sequence data becoming available, ASC can be easily applied to transcriptome datasets from other phytoplankton to identify reference genes.

Keywords: RT-qPCR; Thalassiosira pseudonana; diatom; housekeeping genes; phytoplankton; reference gene; relative gene expression; transcriptome.


Figures

Figure 1
Figure 1
Expression patterns of putative reference genes identified through literature-based searches, k-means clustering, and ASC analysis. Through literature-based searches, a total of 101 genes homologous to reference genes from previous studies on plants and algae were identified in T. pseudonana and plotted to indicate deviation and mean tpm (Literature). k-means clustering was applied to the 7380 genes and Cluster 9 (243 genes) and Cluster 14 (466 genes) possessed the genes with the most stable expression pattern across the four treatments. Genes from these clusters are plotted to indicate deviation and mean tpm (k-means: Cluster 9; k-means: Cluster 14). ASC was used to assess statistical significance (post-p < 0.1) of fold changes of 1.10, 1.25, and 1.50 for each treatment relative to the replete control. Genes from these fold change bins are plotted to indicate deviation and mean tpm (ASC: 1.50 fold change; ASC: 1.25 fold change; ASC 1.10 fold change). For a fold change of 1.10, two genes, both hypothetical proteins, (NCBI: 7446346 and 7452192) passed the post-p < 0.1 cutoff, and represent the most stable genes based on the ASC analysis (Data Sheet 3). For each of the six classes of putative reference genes, tag counts were normalized to total library size (in tpm) and are plotted relative to the mean for each of the four treatments: Rep, Replete; P-lim, P-limited; Fe-lim, Fe-limited; and Co-lim, Co-limited. The color of the line correlates to the mean normalized tag count. A star marks a gene (NCBI: 7451632) in Cluster 14 that is not on the scale of expression for P-limited (1104.7 tpm) and Co-limited (-1664.9 tpm) treatments.
Figure 2
Figure 2
Average deviation from the mean level of expression for all genes found with literature-based searches, k-means clustering, and ASC analysis of 1.25 fold change. The average change in tag count from the mean expression (tpm) for all the genes identified through literature-based searches for genes homologous to known reference genes from the literature (n = 101), k-means clustering from Cluster 9 (n = 243) and Cluster 14 (n = 466), and ASC analysis identifying genes demonstrating a 1.25 fold change with a post-p < 0.1 (n = 179). The mean standard deviations for the four cases are as follows: Literature (92.62 tpm), Cluster 9 (41.66 tpm), Cluster 14 (43.12 tpm), and ASC (14.24 tpm). The mean tpm is plotted for the four treatments: Replete (Rep), P-limited (P-lim), Fe-limited (Fe-lim), and Co-limited (Co-lim).
Figure 3
Figure 3
Comparison of possible reference genes found with literature-based searches, k-means clustering, and ASC analysis of 1.25 fold change. Venn diagram analysis was used to compare genes identified as candidate reference genes through literature-based homolog searches (totaling 101 genes), with the k-means clustering method (genes in Cluster 9 and Cluster 14, totaling 709 genes), and with quantitative exclusion by ASC (based on genes demonstrating a 1.25 fold change with a post-p < 0.1, totaling 179 genes). The number of genes in each region is reported. The intersection of all ASC and literature-based searches yielded six total genes representing three different gene families: actin (NCBI: 7449411), cyclophilin (NCBI: 7445376), and ubiquitin ligase (NCBI: 7448637, 7450639, 7446724, and 7451971).
Figure A1
Figure A1
Histogram analysis of the distribution of normalized tag counts (tpm) for each gene across each of the four treatments (Replete, P-limited, Fe-limited, and Co-limited). The abundance of normalized tag counts (tpm) was assessed, tallying the total number of genes with a given tag count. Only tag counts less than 20 are depicted to aid the visualization of the inflection in the data at 2.5 tpm.
Figure A2
Figure A2
k-means clustering of normalized genes. The 7380 genes that passed the 2.5 tpm cutoff were clustered into 15 clusters using the k-means algorithm under the Pearson correlation coefficient. Tag counts normalized to total library size (in tpm) for each gene are plotted relative to the mean (indicated by the color of the line) for each of the four treatments: Replete (Rep), P-limited (P-lim), Fe-limited (Fe-lim), and Co-limited (Co-lim).

References

    1. Adib T. R., Henderson S., Perrett C., Hewitt D., Bourmpoulia D., Ledermann J., et al. (2004). Predicting biomarkers for ovarian cancer using gene-expression microarrays. Br. J. Cancer 90, 686–692 10.1038/sj.bjc.6601603 - DOI - PMC - PubMed
    1. Allen A. E., LaRoche J., Maheswari U., Lommer M., Schauer N., Lopez P. J., et al. (2008). Whole-cell response of the pennate diatom Phaeodactylum tricornutum to iron starvation. Proc. Natl. Acad. Sci. U.S.A. 105, 10438–10443 10.1073/pnas.0711370105 - DOI - PMC - PubMed
    1. Altschul S. F., Madden T. L., Schäffer A. A., Zhang J., Zhang Z., Miller W., et al. (1997). Gapped BLAST and PSI-BLAST: a new generation of protein database search programs. Nucleic Acids Res. 25, 3389–3402 10.1093/nar/25.17.3389 - DOI - PMC - PubMed
    1. Antonov J., Goldstein D. R., Oberli A., Baltzer A., Pirotta M., Fleischmann A., et al. (2005). Reliable gene expression measurements from degraded RNA by quantitative real-time PCR depend on short amplicons and a proper normalization. Lab. Invest. 85, 1040–1050 10.1038/labinvest.3700303 - DOI - PubMed
    1. Armbrust E. V., Berges J. A., Bowler C., Green B. R., Martinez D., et al. (2004). The genome of the diatom Thalassiosira pseudonana: ecology, evolution, and metabolism. Science 306, 79–86 10.1126/science.1101156 - DOI - PubMed