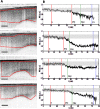
In vivo detection of cortical optical changes associated with seizure activity with optical coherence tomography
- PMID: 23162709
- PMCID: PMC3493229
- DOI: 10.1364/BOE.3.002700
In vivo detection of cortical optical changes associated with seizure activity with optical coherence tomography
Abstract
The most common technology for seizure detection is with electroencephalography (EEG), which has low spatial resolution and minimal depth discrimination. Optical techniques using near-infrared (NIR) light have been used to improve upon EEG technology and previous research has suggested that optical changes, specifically changes in near-infrared optical scattering, may precede EEG seizure onset in in vivo models. Optical coherence tomography (OCT) is a high resolution, minimally invasive imaging technique, which can produce depth resolved cross-sectional images. In this study, OCT was used to detect changes in optical properties of cortical tissue in vivo in mice before and during the induction of generalized seizure activity. We demonstrated that a significant decrease (P < 0.001) in backscattered intensity during seizure progression can be detected before the onset of observable manifestations of generalized (stage-5) seizures. These results indicate the feasibility of minimally-invasive optical detection of seizures with OCT.
Keywords: (100.2960) Image analysis; (110.4500) Optical coherence tomography; (170.3880) Medical and biological imaging.
Figures


References
-
- Andrzejak R. G., Chicharro D., Elger C. E., Mormann F., “Seizure prediction: any better than chance?” Clin. Neurophysiol. 120(8), 1465–1478 (2009), http://www.opticsinfobase.org/abstract.cfm?uri=BIOMED-2010-BSuD110p10.1016/j.clinph.2009.05.019 - DOI - PubMed
-
- Seungduk L., Hyun J. L., Changkyun I., Hyung-Cheul S., Dalkwon K., Beop-Min K., “Simultaneous measurement of hemodynamic and neuronal activities using near-infrared spectroscopy and single-unit recording,” J. Korean Phys. Soc. 58(6), 1697–1702 (2011).10.3938/jkps.58.1697 - DOI
-
- J. R. Weber, M. S. Hsu, A. Lin, D. Lee, C. Owen, D. K. Binder, D. J. Cuccia, W. R. Johnson, G. Bearman, A. J. Durkin, and B. J. Tromberg, “Noncontact imaging of seizure using multispectral spatial frequency domain imaging,” in Biomedical Optics, OSA Technical Digest (CD) (Optical Society of America, 2010), paper BSuD110p.
Grants and funding
LinkOut - more resources
Full Text Sources
Other Literature Sources
Miscellaneous
