. 2012 Nov 1;3(11):2809-24.
doi: 10.1364/BOE.3.002809. Epub 2012 Oct 15.

Automatic stent detection in intravascular OCT images using bagged decision trees

Affiliations

Automatic stent detection in intravascular OCT images using bagged decision trees

Hong Lu et al. Biomed Opt Express. .

Abstract

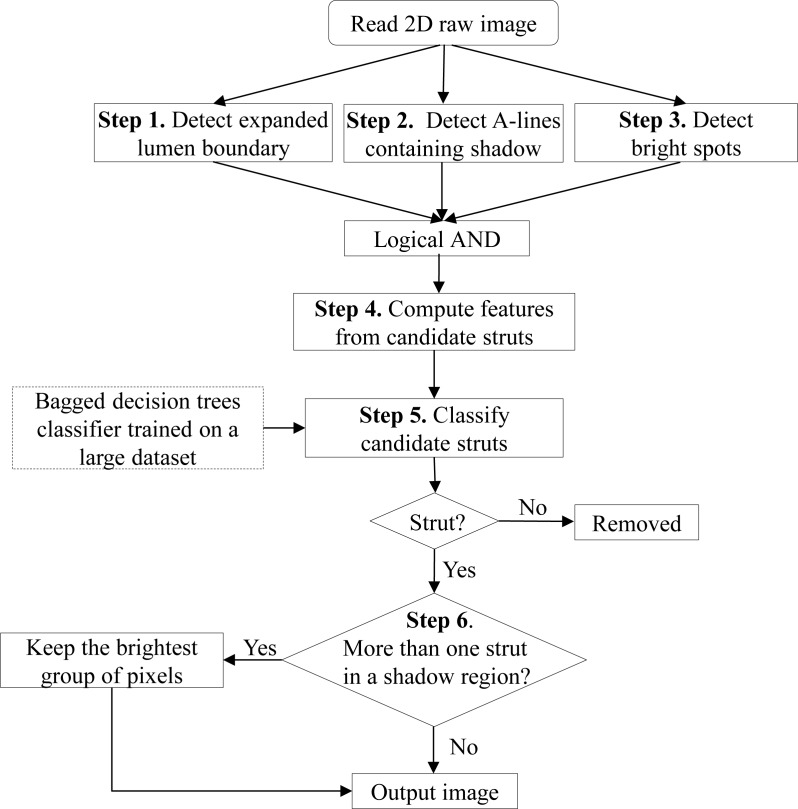
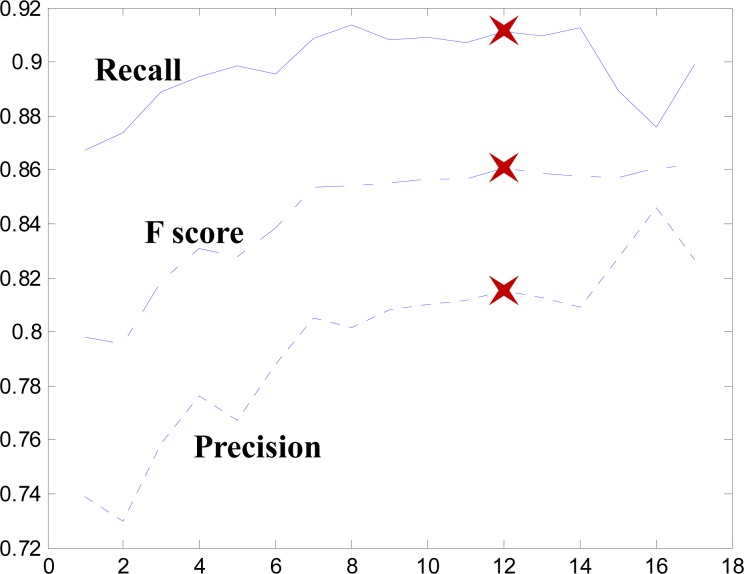
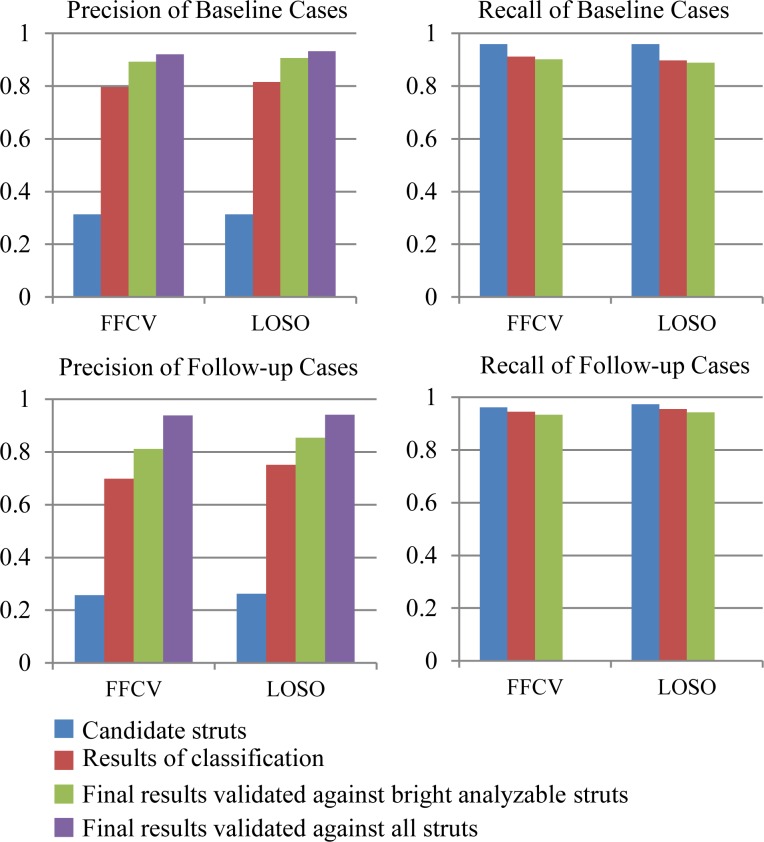
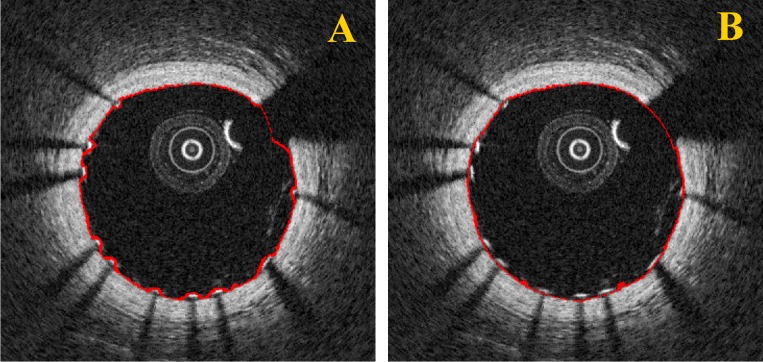
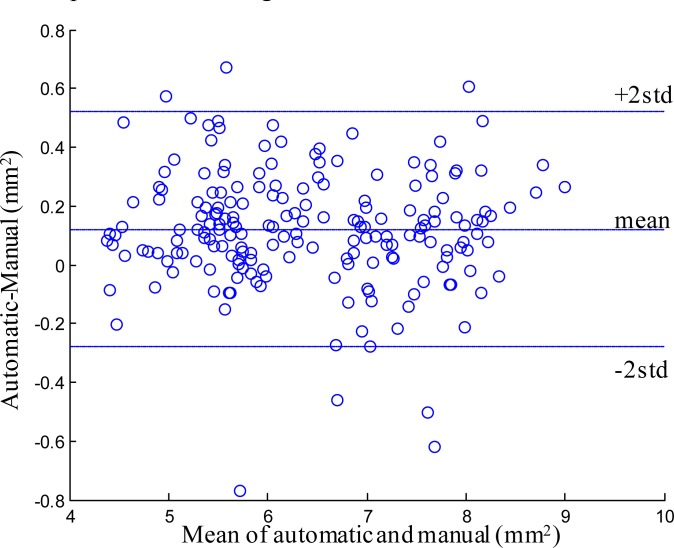
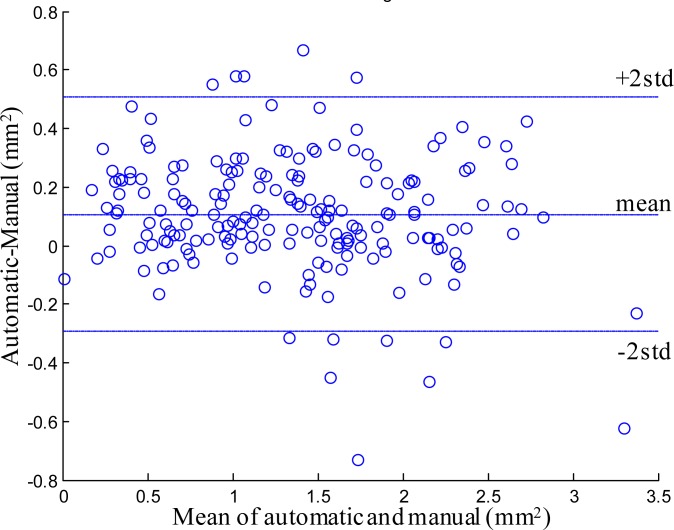
Intravascular optical coherence tomography (iOCT) is being used to assess viability of new coronary artery stent designs. We developed a highly automated method for detecting stent struts and measuring tissue coverage. We trained a bagged decision trees classifier to classify candidate struts using features extracted from the images. With 12 best features identified by forward selection, recall (precision) were 90%-94% (85%-90%). Including struts deemed insufficiently bright for manual analysis, precision improved to 94%. Strut detection statistics approached variability of manual analysis. Differences between manual and automatic area measurements were 0.12 ± 0.20 mm(2) and 0.11 ± 0.20 mm(2) for stent and tissue areas, respectively. With proposed algorithms, analyst time per stent should significantly reduce from the 6-16 hours now required.

Keywords: (100.0100) Image processing; (110.4500) Optical coherence tomography.


Figures

Fig. 1
Fig. 1
Classification-based stent strut detection algorithm.
Fig. 2
Fig. 2
Shadow detection. (A) Intensity profile obtained by summing a predetermined number of pixels, SL, after the lumen border along A-lines in (C). (B) Intensity minima indicative of a shadow are shown (red solid line). The dashed curve is the H-minima transformation, which suppresses minima having a depth <TD1. Intensity minima obtained in (B) are used to generate the shadow mask in (D), where white bands indicate A-lines containing detected shadows. Note that even very thin shadows in the input image (C) are accurately detected. Parameters are given in the text.
Fig. 3
Fig. 3
Bright spot detection and expanded lumen boundary ROI. (A) Input (r,θ) image. (B) Image after h-maxima transformation with all the maxima whose depth is lower than TD2 suppressed, leaving a smoother image suitable for regional maxima detection. (C) Overlay of raw image, ROI mask (region between green lines), and extended maxima (in red) detected by taking the regional maxima of (B). (D) Candidate struts left after the logical AND of ROI mask, shadow mask, and extended maxima.
Fig. 4
Fig. 4
Change of algorithm performance as the number of features increases. 12 features give the best trade-off between precision and recall as marked by red cross on each curve.
Fig. 5
Fig. 5
Detection of bright, analyzable struts. (A) Input image from a baseline case. (B) Detection of “candidate struts” following Steps 1-3, including many FPs. (C) Struts following classification (Steps 4-5). (D) Final result after elimination of extra hits (Step 6), eliminating FPs at 3 o’clock and 7 o’clock.
Fig. 6
Fig. 6
Stent strut detection evaluation. The first and second groups of bars in each panel are from pooling fivefold cross validation (FFCV) and leave-one-stent-out (LOSO), respectively. Between candidate and classification steps, FPs are removed and precision increase significantly. There is little effect on recall. The two validation strategies gave similar results, indicative of generalizability.
Fig. 7
Fig. 7
Demonstration of non-bright and ambiguous struts. (A) Automated strut detection. Bright, analyzable struts (B) and non-bright struts (C) marked by analyst. (D, E) Magnified images of blue and green boxes, respectively, from panel A. Yellow arrows point to ambiguous struts detected automatically in A, but not marked as bright struts by analysts. Small bright reflection spots are evident, suggesting that the software gave proper responses even though these are FPs. Magenta arrows point to non-bright struts identified by analyst and not detected by software as a bright analyzable strut, because no bright reflection spots are present. Comparing A to B, there is a FN strut at 6 o’clock missed by software because it’s too close to the guide wire.
Fig. 8
Fig. 8
Stent contour formation. (A) With a large number of struts (green), a good stent contour is obtained (red). (B) With an insufficient number of detected struts, the stent contour can be in error. (C) The contour from B is corrected by automatically adding “interpolation points” (blue) between detected struts.
Fig. 9
Fig. 9
Lumen border segmentation. (A) Initial lumen border from dynamic programming, which includes errors due to struts on the lumen surface. (B) Lumen border refined by masking out A-lines containing struts prior to dynamic programming.
Fig. 10
Fig. 10
Bland-Altman plot of stent area measurement.
Fig. 11
Fig. 11
Bland-Altman plot of tissue coverage area measurement.
Fig. 12
Fig. 12
3D visualization of stent. Vessel wall is in red and detected struts are in white. 3D reconstruction shows the characteristic pattern of Xience stent (arrows).

Similar articles

Cited by

References

    1. Beijk M. A., Klomp M., Verouden N. J., van Geloven N., Koch K. T., Henriques J. P., Baan J., Vis M. M., Scheunhage E., Piek J. J., Tijssen J. G., de Winter R. J., “Genous endothelial progenitor cell capturing stent vs. the Taxus Liberte stent in patients with de novo coronary lesions with a high-risk of coronary restenosis: a randomized, single-centre, pilot study,” Eur. Heart J. 31(9), 1055–1064 (2010).10.1093/eurheartj/ehp476 - DOI - PMC - PubMed
    1. Granada J. F., Inami S., Aboodi M. S., Tellez A., Milewski K., Wallace-Bradley D., Parker S., Rowland S., Nakazawa G., Vorpahl M., Kolodgie F. D., Kaluza G. L., Leon M. B., Virmani R., “Development of a novel prohealing stent designed to deliver sirolimus from a biodegradable abluminal matrix,” Circ Cardiovasc Interv 3(3), 257–266 (2010).10.1161/CIRCINTERVENTIONS.109.919936 - DOI - PubMed
    1. Bezerra H. G., Costa M. A., Guagliumi G., Rollins A. M., Simon D. I., “Intracoronary optical coherence tomography: a comprehensive review clinical and research applications,” JACC Cardiovasc. Interv. 2(11), 1035–1046 (2009).10.1016/j.jcin.2009.06.019 - DOI - PMC - PubMed
    1. Guagliumi G., Musumeci G., Sirbu V., Bezerra H. G., Suzuki N., Fiocca L., Matiashvili A., Lortkipanidze N., Trivisonno A., Valsecchi O., Biondi-Zoccai G., Costa M. A., ODESSA Trial Investigators , “Optical coherence tomography assessment of in vivo vascular response after implantation of overlapping bare-metal and drug-eluting stents,” JACC Cardiovasc. Interv. 3(5), 531–539 (2010).10.1016/j.jcin.2010.02.008 - DOI - PubMed
    1. Guagliumi G., Sirbu V., Musumeci G., Bezerra H. G., Aprile A., Kyono H., Fiocca L., Matiashvili A., Lortkipanidze N., Vassileva A., Popma J. J., Allocco D. J., Dawkins K. D., Valsecchi O., Costa M. A., “Strut coverage and vessel wall response to a new-generation paclitaxel-eluting stent with an ultrathin biodegradable abluminal polymer: Optical Coherence Tomography Drug-Eluting Stent Investigation (OCTDESI),” Circ Cardiovasc Interv 3(4), 367–375 (2010).10.1161/CIRCINTERVENTIONS.110.950154 - DOI - PubMed

LinkOut - more resources