Comparative Study
. 2012 Nov 7:2:133.
doi: 10.3389/fcimb.2012.00133. eCollection 2012.

Comparative genomics and stx phage characterization of LEE-negative Shiga toxin-producing Escherichia coli

Affiliations
Comparative Study

Comparative genomics and stx phage characterization of LEE-negative Shiga toxin-producing Escherichia coli

Susan R Steyert et al. Front Cell Infect Microbiol. .

Abstract

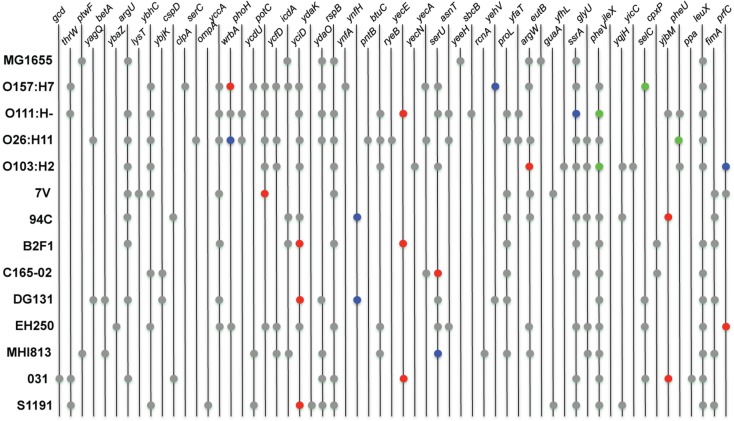
Infection by Escherichia coli and Shigella species are among the leading causes of death due to diarrheal disease in the world. Shiga toxin-producing E. coli (STEC) that do not encode the locus of enterocyte effacement (LEE-negative STEC) often possess Shiga toxin gene variants and have been isolated from humans and a variety of animal sources. In this study, we compare the genomes of nine LEE-negative STEC harboring various stx alleles with four complete reference LEE-positive STEC isolates. Compared to a representative collection of prototype E. coli and Shigella isolates representing each of the pathotypes, the whole genome phylogeny demonstrated that these isolates are diverse. Whole genome comparative analysis of the 13 genomes revealed that in addition to the absence of the LEE pathogenicity island, phage-encoded genes including non-LEE encoded effectors, were absent from all nine LEE-negative STEC genomes. Several plasmid-encoded virulence factors reportedly identified in LEE-negative STEC isolates were identified in only a subset of the nine LEE-negative isolates further confirming the diversity of this group. In combination with whole genome analysis, we characterized the lambdoid phages harboring the various stx alleles and determined their genomic insertion sites. Although the integrase gene sequence corresponded with genomic location, it was not correlated with stx variant, further highlighting the mosaic nature of these phages. The transcription of these phages in different genomic backgrounds was examined. Expression of the Shiga toxin genes, stx(1) and/or stx(2), as well as the Q genes, were examined with quantitative reverse transcriptase polymerase chain reaction assays. A wide range of basal and induced toxin induction was observed. Overall, this is a first significant foray into the genome space of this unexplored group of emerging and divergent pathogens.

Keywords: Escherichia coli; Shiga toxin; evolution; microbial genomics; phage.


Figures

Figure 1
Figure 1
A whole genome phylogeny of nine LEE-negative (red) and four LEE-positive (blue) STEC compared in this study. Whole genome sequences for the LEE-negative STEC sequenced in this study (indicated by asterisks) was combined with sequence data obtained from GenBank for E. coli/Shigella genomes representing the major pathotypes (Table A1 in Appendix), and aligned based on concatenated regions of shared sequence as determined from analysis using Mugsy (Angiuoli and Salzberg, 2011). The phylogenetic tree was inferred with E. fergusonii isolate 35469 as the outgroup.
Figure 2
Figure 2
A virulence gene profile based on BLAST score ratio (BSR) analysis. BSR analysis was performed on the genomes to determine the presence and level of protein sequence identity of selected virulence factors. Unless an E. coli isolate is otherwise indicated in the gene label, reference protein sequences were taken from the LEE-positive O157:H7 EDL933 isolate with the exception of the proteins encoded on pO113, which were taken from STEC O113:H21 isolate EH41. Yellow indicates a higher level of similarity, blue indicates a lower level of similarity, and black indicates ∼50% identity over the length of the sequence queried.
Figure 3
Figure 3
Chromosomal location of phage integration. Locations of phage were determined by identifying integrase genes in the genomes of the LEE-negative STEC isolates. Insertion sites were obtained from GenBank for the four reference LEE-positive STEC isolates and E. coli MG1655 K12. Prophages encoding stx1 and stx2 are represented in blue and red, respectively. The LEE pathogenicity island is indicated by green, and locations of all other insertion elements are represented in gray.
Figure 4
Figure 4
A comparison of induced stx and Q gene expression. Mid-log phase cultures were incubated for 2 h either in the presence or absence of mitomycin C and relative mRNA levels were determined with qRT-PCR. stx (A) and Q (B) mRNA expression comparisons were made of mitomycin C-treated cultures relative to un-induced cultures (value of 1 signifies no induction for that particular stx in the isolate). Values and standard errors are presented and are based on results from three independent biological replicates each measured with technical triplicates. Results are displayed in gray for stx1-encoding phages, black for stx2-encoding phages, and checkered where the expression from the stx1 and stx2 phages could not be distinguished. The Q genes associated with the stx2b and stx2g phages in isolates EH250 and 7V, respectively, were each found to be associated with another phage in the isolate, thus the measured Q expression might have a contribution from that Q gene as well.
Figure 5
Figure 5
Gene organization flanking the stx genes and Q gene phylogeny for the stx phages in the LEE-negative STEC isolates and LEE-positive O157:H7 EDL933. Gene organization comparisons are shown for (A) stx1-encoding phages and (B) stx2-encoding phages. The colors correspond to the following gene designations: gray, rusA; yellow, Q; orange, DNA methylase; pink, tRNA genes; red, stxAB; green, yjhS; blue, lysis S, and endolysin genes; white, all other genes, predominantly encoding hypothetical proteins. A cluster diagram based on the Q gene sequences was determined (C) and primers (Table 2) were designed to be specific for each cluster according to the colors: Q1 green, Q2 purple, Q3 turquoise, Q4 blue, Q5 magenta, Q6a orange, and Q6b red. Clusters circled by a solid black line denote a high level of stx induction, gray circles denote intermediate level induction, and broken lines denote lack of induction.
Figure A1
Figure A1
Shiga toxin gene phylogeny. A phylogenetic tree was constructed from an alignment of concatenated stxA and stxB gene subunits for each of the Shiga toxins encoded in the 13 isolates compared in this study.
Figure A2
Figure A2
Relationship between integrase gene phylogeny and chromosomal location of insertion elements. Integrase gene sequences were extracted from the LEE-negative STEC genomes and the gene adjacent to the integrase gene was designated as the insertion site. Integrase gene sequences were obtained from GenBank for the E. coli K12 MG1655 genome along with the four reference LEE-positive STEC genomes. A phylogenetic tree was inferred from an alignment of the integrase genes, and displays the predominant correlation between integrase gene sequence and chromosomal location of the insertion element. Integrase genes extracted from stx-encoding phages in the LEE-negative STEC genomes are depicted in red, while those from the reference LEE-positive STEC genomes are depicted in blue and the integrase genes associated with the LEE pathogenicity island are denoted in green. An integrase gene could not be identified in the STEC 94C stx2a and STEC O31 stx2c prophages, thus those phages are not included in this analysis.
Figure A3
Figure A3
Sequence comparison of the stx-encoding prophages. Phage sequences extracted from the genomes of the nine LEE-negative STEC isolates and obtained from GenBank for the four reference LEE-positive STEC genomes were subjected to sequence analysis using Mauve (Darling et al., 2010). Similar color denotes regions of shared sequence and the height of the bars denotes level of similarity of the shared sequence regions. Regions where there is a line, but no colored bars, indicate a lack of homology with any of the other phages in the comparison. The location of the stx genes is identified with an asterisk (*), the plus (+) signifies that the 3′ end of phage could not be determined unambiguously from the sequence data, and the double hash (//) denotes a gap in known sequence data.

Similar articles

Cited by

References

    1. Altschul S. F., Madden T. L., Schaffer A. A., Zhang J., Zhang Z., Miller W., et al. (1997). Gapped BLAST and PSI-BLAST: a new generation of protein database search programs. Nucleic Acids Res. 25, 3389–340210.1093/nar/25.17.3389 - DOI - PMC - PubMed
    1. Angiuoli S. V., Salzberg S. L. (2011). Mugsy: fast multiple alignment of closely related whole genomes. Bioinformatics 27, 334–34210.1093/bioinformatics/btq665 - DOI - PMC - PubMed
    1. Asadulghani M., Ogura Y., Ooka T., Itoh T., Sawaguchi A., Iguchi A., et al. (2009). The defective prophage pool of Escherichia coli O157: prophage-prophage interactions potentiate horizontal transfer of virulence determinants. PLoS Pathog. 5, e1000408.10.1371/journal.ppat.1000408 - DOI - PMC - PubMed
    1. Barrangou R., Fremaux C., Deveau H., Richards M., Boyaval P., Moineau S., et al. (2007). CRISPR provides acquired resistance against viruses in prokaryotes. Science 315, 1709–171210.1126/science.1138140 - DOI - PubMed
    1. Beutin L., Kruger U., Krause G., Miko A., Martin A., Strauch E. (2008). Evaluation of major types of Shiga toxin 2E-producing Escherichia coli bacteria present in food, pigs, and the environment as potential pathogens for humans. Appl. Environ. Microbiol. 74, 4806–481610.1128/AEM.00623-08 - DOI - PMC - PubMed

Publication types

LinkOut - more resources