Quantification of transition dipole strengths using 1D and 2D spectroscopy for the identification of molecular structures via exciton delocalization: application to α-helices
- PMID: 23163364
- PMCID: PMC3511336
- DOI: 10.1063/1.4764861
Quantification of transition dipole strengths using 1D and 2D spectroscopy for the identification of molecular structures via exciton delocalization: application to α-helices
Abstract
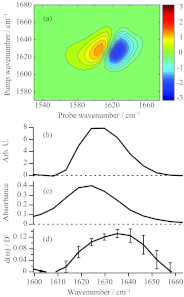
Vibrational and electronic transition dipole strengths are often good probes of molecular structures, especially in excitonically coupled systems of chromophores. One cannot determine transition dipole strengths using linear spectroscopy unless the concentration is known, which in many cases it is not. In this paper, we report a simple method for measuring transition dipole moments from linear absorption and 2D IR spectra that does not require knowledge of concentrations. Our method is tested on several model compounds and applied to the amide I(') band of a polypeptide in its random coil and α-helical conformation as modulated by the solution temperature. It is often difficult to confidently assign polypeptide and protein secondary structures to random coil or α-helix by linear spectroscopy alone, because they absorb in the same frequency range. We find that the transition dipole strength of the random coil state is 0.12 ± 0.013 D(2), which is similar to a single peptide unit, indicating that the vibrational mode of random coil is localized on a single peptide unit. In an α-helix, the lower bound of transition dipole strength is 0.26 ± 0.03 D(2). When taking into account the angle of the amide I(') transition dipole vector with respect to the helix axis, our measurements indicate that the amide I(') vibrational mode is delocalized across a minimum of 3.5 residues in an α-helix. Thus, one can confidently assign secondary structure based on exciton delocalization through its effect on the transition dipole strength. Our method will be especially useful for kinetically evolving systems, systems with overlapping molecular conformations, and other situations in which concentrations are difficult to determine.
Figures


Similar articles
-
Not All β-Sheets Are the Same: Amyloid Infrared Spectra, Transition Dipole Strengths, and Couplings Investigated by 2D IR Spectroscopy.J Phys Chem B. 2017 Sep 28;121(38):8935-8945. doi: 10.1021/acs.jpcb.7b06826. Epub 2017 Sep 19. J Phys Chem B. 2017. PMID: 28851219 Free PMC article.
-
Normal mode calculation and infrared spectroscopy of proteins in water solution: Relationship between amide I transition dipole strength and secondary structure.Int J Biol Macromol. 2021 Aug 31;185:369-376. doi: 10.1016/j.ijbiomac.2021.06.092. Epub 2021 Jun 19. Int J Biol Macromol. 2021. PMID: 34157332
-
Orientation determination of protein helical secondary structures using linear and nonlinear vibrational spectroscopy.J Phys Chem B. 2009 Sep 10;113(36):12169-80. doi: 10.1021/jp904153z. J Phys Chem B. 2009. PMID: 19650636 Free PMC article.
-
Amide I two-dimensional infrared spectroscopy of proteins.Acc Chem Res. 2008 Mar;41(3):432-41. doi: 10.1021/ar700188n. Epub 2008 Feb 21. Acc Chem Res. 2008. PMID: 18288813 Review.
-
Using 2D-IR Spectroscopy to Measure the Structure, Dynamics, and Intermolecular Interactions of Proteins in H2O.Acc Chem Res. 2024 Mar 5;57(5):685-692. doi: 10.1021/acs.accounts.3c00682. Epub 2024 Feb 16. Acc Chem Res. 2024. PMID: 38364823 Free PMC article. Review.
Cited by
-
Applications of two-dimensional infrared spectroscopy.Analyst. 2015 Jul 7;140(13):4336-49. doi: 10.1039/c5an00558b. Analyst. 2015. PMID: 26007625 Free PMC article. Review.
-
Structural Polymorphs Suggest Competing Pathways for the Formation of Amyloid Fibrils That Diverge from a Common Intermediate Species.Biochemistry. 2018 Nov 20;57(46):6470-6478. doi: 10.1021/acs.biochem.8b00997. Epub 2018 Nov 6. Biochemistry. 2018. PMID: 30375231 Free PMC article.
-
Unraveling VEALYL Amyloid Formation Using Advanced Vibrational Spectroscopy and Microscopy.Biophys J. 2020 Jul 7;119(1):87-98. doi: 10.1016/j.bpj.2020.05.026. Epub 2020 Jun 3. Biophys J. 2020. PMID: 32562617 Free PMC article.
-
Cross-α/β polymorphism of PSMα3 fibrils.Proc Natl Acad Sci U S A. 2022 Feb 1;119(5):e2114923119. doi: 10.1073/pnas.2114923119. Proc Natl Acad Sci U S A. 2022. PMID: 35078934 Free PMC article.
-
Synthesis of 5-Cyano-Tryptophan as a Two-Dimensional Infrared Spectroscopic Reporter of Structure.Angew Chem Int Ed Engl. 2018 Jun 18;57(25):7528-7532. doi: 10.1002/anie.201803849. Epub 2018 May 29. Angew Chem Int Ed Engl. 2018. PMID: 29710418 Free PMC article.
References
-
- Graff D. K., Pastrana-Rios B., Venyaminov S. Y., and Prendergast F. G., J. Am. Chem. Soc. 119, 11282 (1997).10.1021/ja970512m - DOI
Publication types
MeSH terms
Substances
Grants and funding
LinkOut - more resources
Full Text Sources

