. 2012 Dec 20;116(50):14565-80.
doi: 10.1021/jp3094935. Epub 2012 Dec 10.

Normal mode analysis of the spectral density of the Fenna-Matthews-Olson light-harvesting protein: how the protein dissipates the excess energy of excitons

Affiliations

Normal mode analysis of the spectral density of the Fenna-Matthews-Olson light-harvesting protein: how the protein dissipates the excess energy of excitons

Thomas Renger et al. J Phys Chem B. .

Abstract

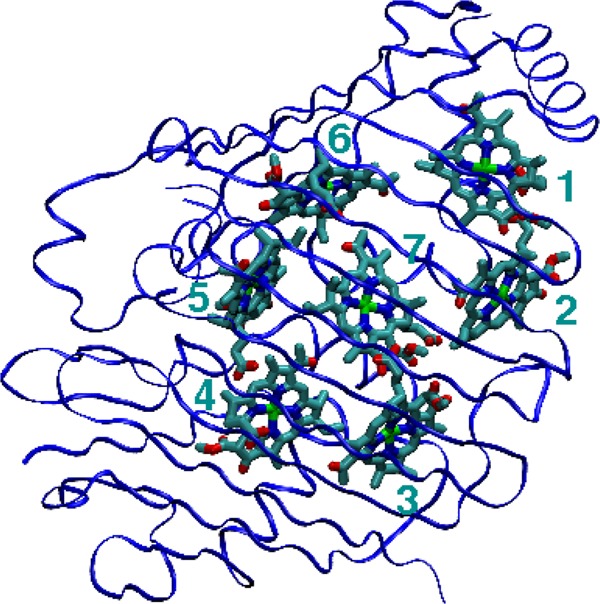
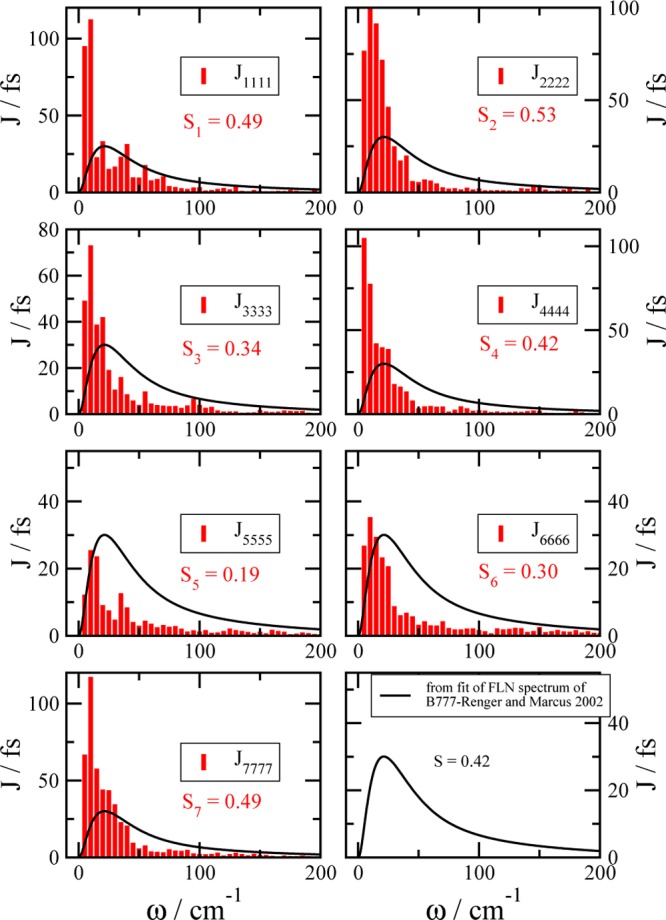
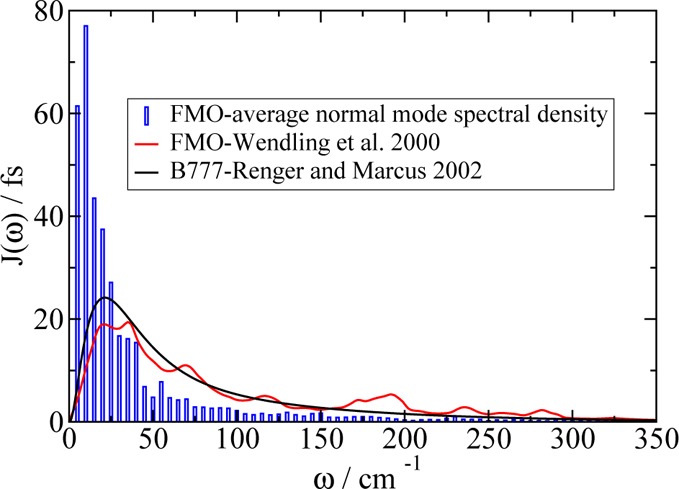
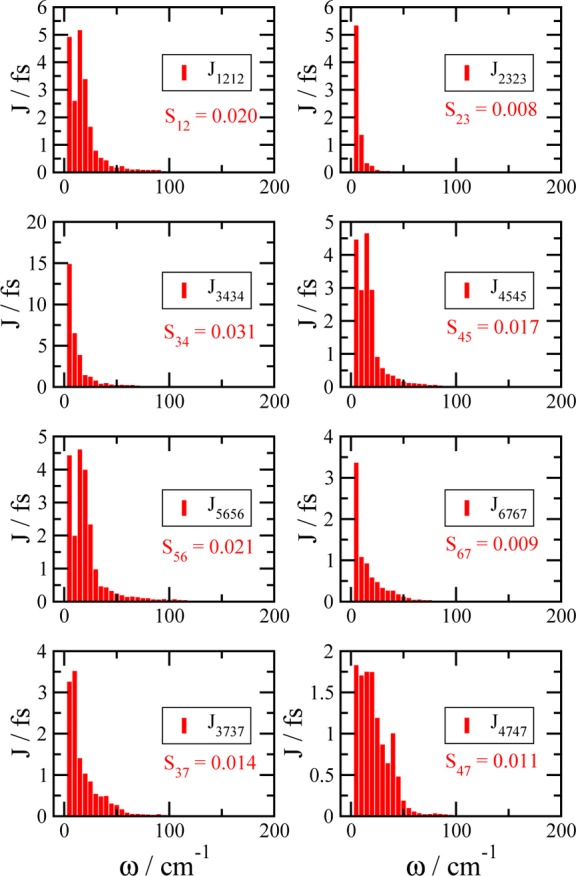
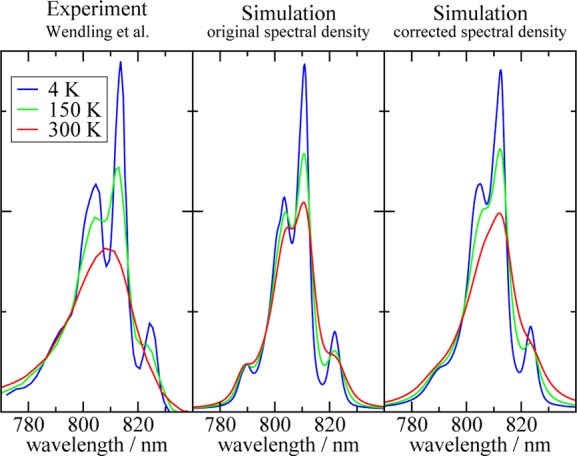
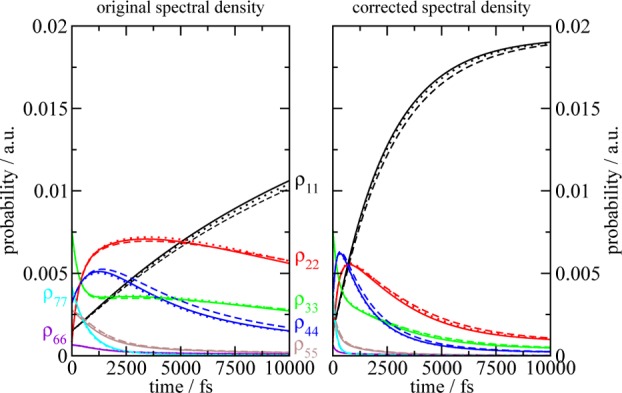
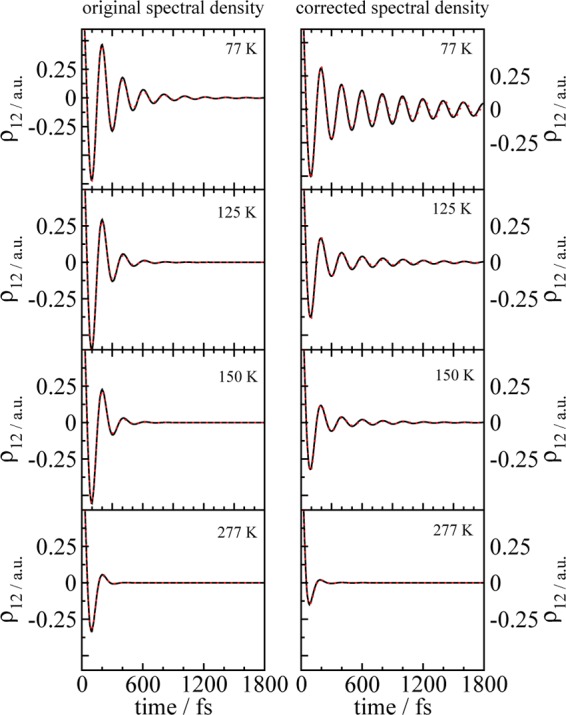
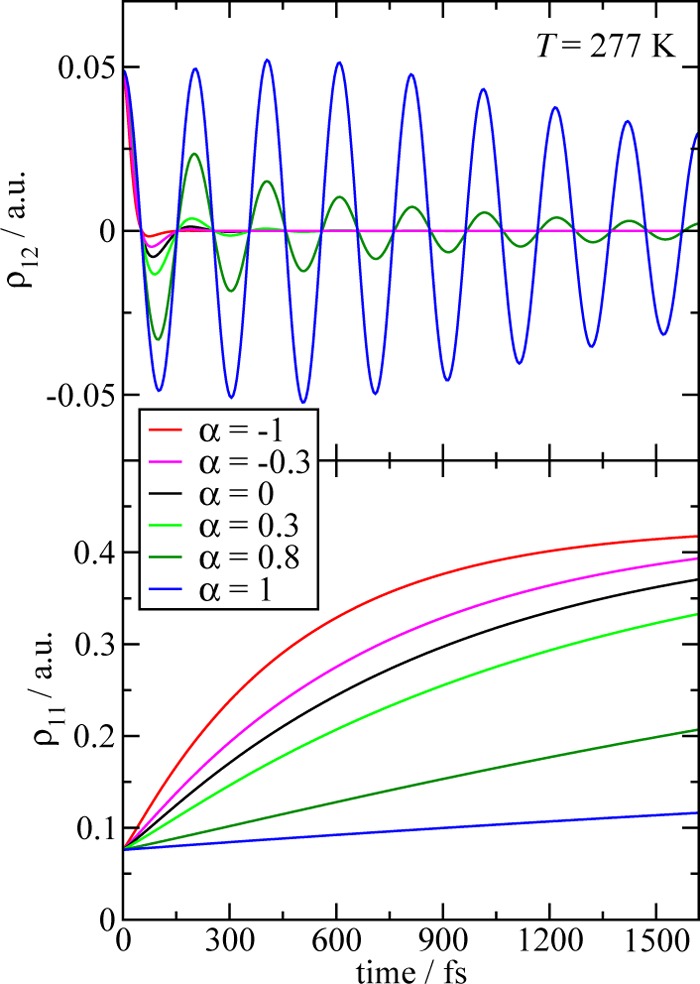
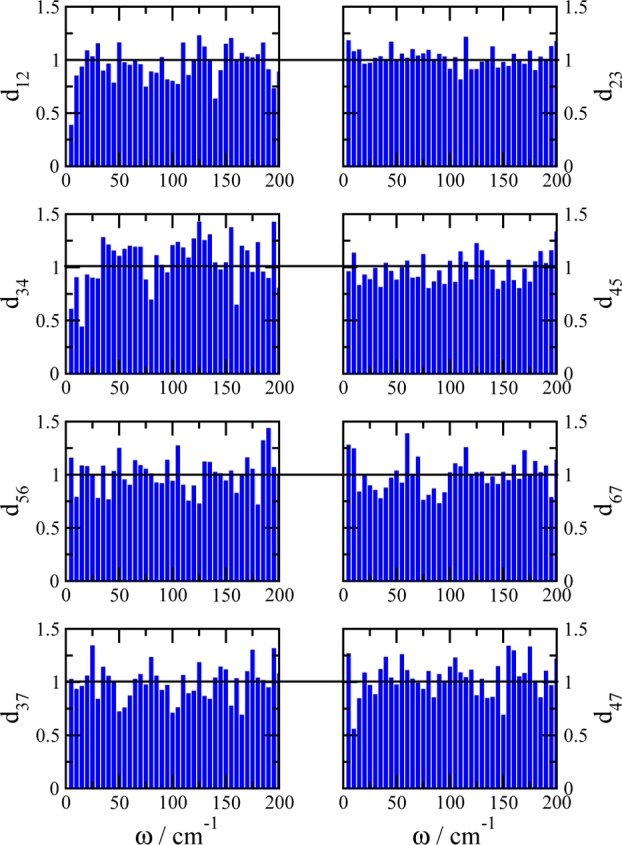
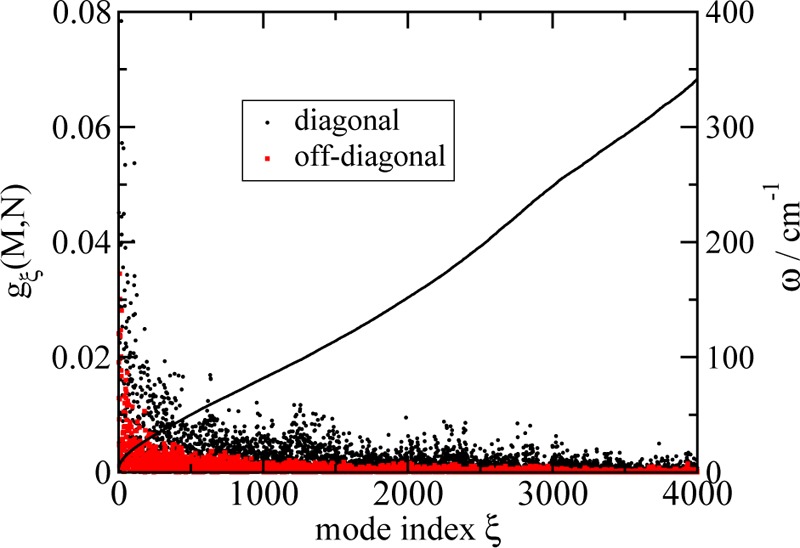
We report a method for the structure-based calculation of the spectral density of the pigment-protein coupling in light-harvesting complexes that combines normal-mode analysis with the charge density coupling (CDC) and transition charge from electrostatic potential (TrEsp) methods for the computation of site energies and excitonic couplings, respectively. The method is applied to the Fenna-Matthews-Olson (FMO) protein in order to investigate the influence of the different parts of the spectral density as well as correlations among these contributions on the energy transfer dynamics and on the temperature-dependent decay of coherences. The fluctuations and correlations in excitonic couplings as well as the correlations between coupling and site energy fluctuations are found to be 1 order of magnitude smaller in amplitude than the site energy fluctuations. Despite considerable amplitudes of that part of the spectral density which contains correlations in site energy fluctuations, the effect of these correlations on the exciton population dynamics and dephasing of coherences is negligible. The inhomogeneous charge distribution of the protein, which causes variations in local pigment-protein coupling constants of the normal modes, is responsible for this effect. It is seen thereby that the same building principle that is used by nature to create an excitation energy funnel in the FMO protein also allows for efficient dissipation of the excitons' excess energy.


Figures

Figure 1
Figure 1
Monomeric subunit of the FMO protein of Prosthecochloris aestuarii(6) containing seven BChla pigments (apo-form).
Figure 2
Figure 2
Spectral densities Jmmmm(ω) describing the fluctuation of site energies of the pigments m = 1···7. The Jmmmm(ω) are represented as histograms, where the ω-axis has been discretized in steps of 5 cm–1. For comparison, we show J(ω), the shape of which was obtained from a fit of fluorescence line narrowing spectra of a one-pigment system, the B777 complex (solid black line), and the integral coupling strength, i.e., the Huang–Rhys factor S = 0.42, was obtained from a fit of the temperature dependence of the linear absorbance spectrum of the FMO protein (Figure 6). The individual Huang–Rhys factors Sm (eq 38) of the pigments, obtained from the NMA, are shown as well.
Figure 3
Figure 3
Comparison of the average spectral density diag(ω) (eq 39) of site energy fluctuations of the seven pigments, shown separately in Figure 2, with the experimental spectral density of the B777 complex and the FMO protein. The latter two have been rescaled to the Huang–Rhys factor = 0.39 of diag(ω) (eq 39), resulting from the NMA, for better comparison.
Figure 4
Figure 4
Spectral densities Jmmnn(ω) describing the correlations in site energy fluctuations of pigments m and n. The pigment pairs with the largest correlation strengths, characterized by the generalized Huang–Rhys factors Smmnn (eq 40), are shown.
Figure 5
Figure 5
Spectral densities Jmnmn(ω) characterizing the fluctuations of excitonic couplings between pigments m and n are shown for those pigment pairs with the largest fluctuations, characterized by the Huang–Rhys factors Smn (eq 41).
Figure 6
Figure 6
Linear absorbance spectrum at three different temperatures. The experimental data (left) are compared to simulations obtained with the directly calculated spectral density Jmnkl(ω) (middle) and with the corrected spectral density Jmnklc(ω) (right).
Figure 7
Figure 7
Population of exciton states after δ-pulse excitation at t = 0, calculated with the original spectral density Jmnkl(ω) (left part) and the corrected one Jmnklc(ω) (right part) at T = 77 K. The solid curves show results obtained by taking into account the full spectral density Jmnkl(c)(ω). The dashed and dotted curves show simulations, where only uncorrelated site energy fluctuations (Jmmmm(c)(ω)) and uncorrelated site energy and coupling fluctuations (Jmnmn(c)(ω)), respectively, were included. Please note that the sum probability of excited state populations is a constant that depends on the amplitude of the external field, which was chosen small enough to justify the second-order perturbation theory used for the initial populations (eq 27).
Figure 8
Figure 8
Dephasing of coherences ρ12, created by a δ-pulse acting at t = 0, between the two lowest exciton states in dependence on temperature, obtained for the original (left part) and the corrected (right part) spectral density, Jmnkl(ω) and Jmnklc(ω), respectively. The real part of ρ12 is shown. The solid black lines show calculations obtained using all parts of the spectral densities, and for the red-dotted lines, all correlations were neglected by including only Jmnmn(c)(ω) and setting all other elements to zero. The solid and dotted lines lie practically on top of each other.
Figure 9
Figure 9
Dephasing of coherences ρ12 (upper part) and population of the lowest exciton state ρ11 (lower part) at T = 277 K, following excitation by a δ-pulse acting at t = 0, for different forms of the site energy correlation part of the spectral density Jmmnnprotect(ω), created artificially from the site energy fluctuation parts Jmmmmc(ω) and Jnnnnc(ω) of the NMA, as described in detail in the text (eq 44).
Figure 10
Figure 10
Dephasing coefficients dmn(ω), defined in the text (eq 45), for those pigment pairs m and n with the largest correlations in site energy fluctuations.
Figure 11
Figure 11
Coupling constants gξ(M,N) of exciton–vibrational coupling of delocalized exciton states, obtained from eq 15, using the microscopic coupling constants gξ(m,n) from the NMA as a function of normal mode index ξ for the first 4000 normal modes. The black solid line shows the corresponding normal-mode frequencies ω = ωξ.

References

    1. Scholes G. D.; Fleming G. R.; Olaya-Castro A.; van Grondelle R. Nat. Chem. 2011, 3, 763–774. - PubMed
    1. Law C. J.; Cogdell R. J.. The light-harvesting system of purple anoxygenic photosynthetic bacteria. In Primary processes of photosynthesis-Part 1, principles and apparatus; Renger G., Ed.; RSC Publishing: Cambridge, U.K., 2008; pp 205–260.
    1. Renger T. Photosynth. Res. 2009, 102, 471–485. - PubMed
    1. Fenna R. E.; Matthews B. W. Nature 1975, 258, 573–577.
    1. Tronrud D. E.; Schmidt M. F.; Matthews B. W. J. Mol. Biol. 1986, 188, 443–454. - PubMed

Publication types

Substances