

Modelling biofilm-induced formation damage and biocide treatment in subsurface geosystems
- PMID: 23164434
- PMCID: PMC3815385
- DOI: 10.1111/1751-7915.12002
Modelling biofilm-induced formation damage and biocide treatment in subsurface geosystems
Abstract
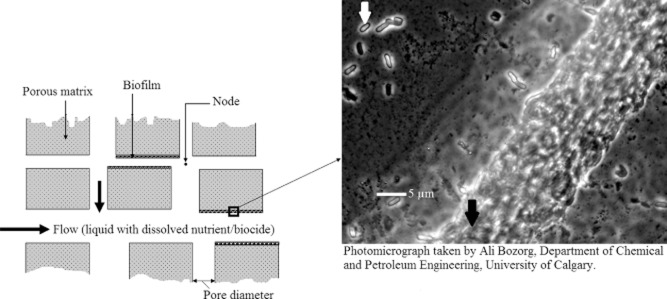
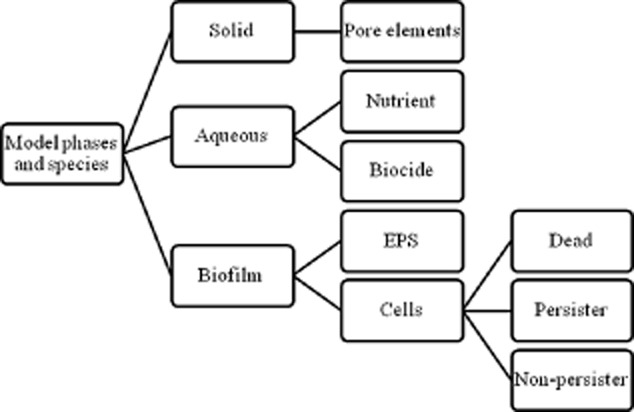
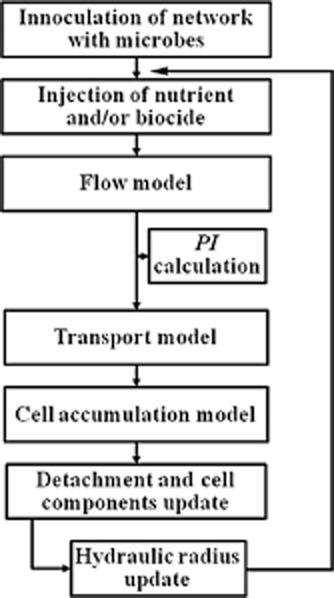
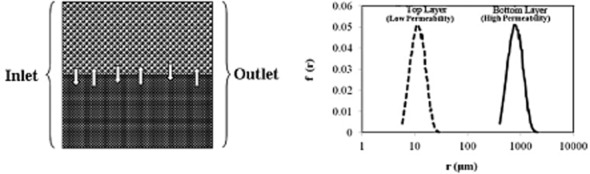
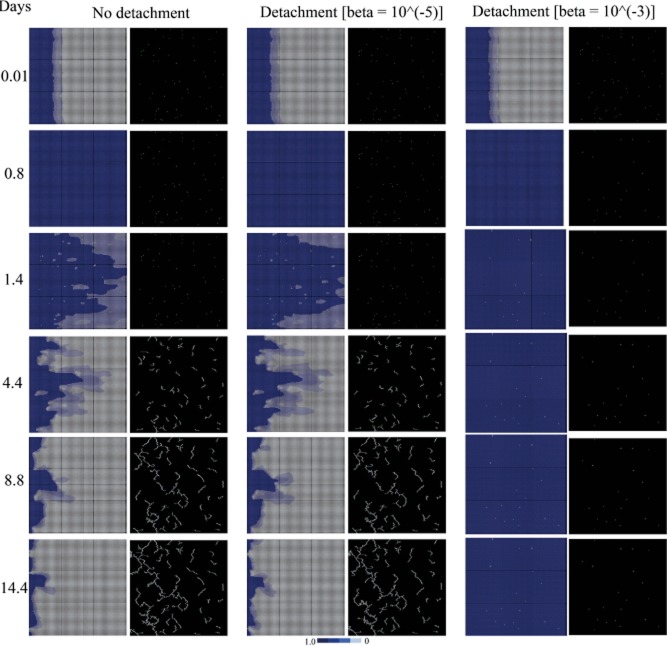
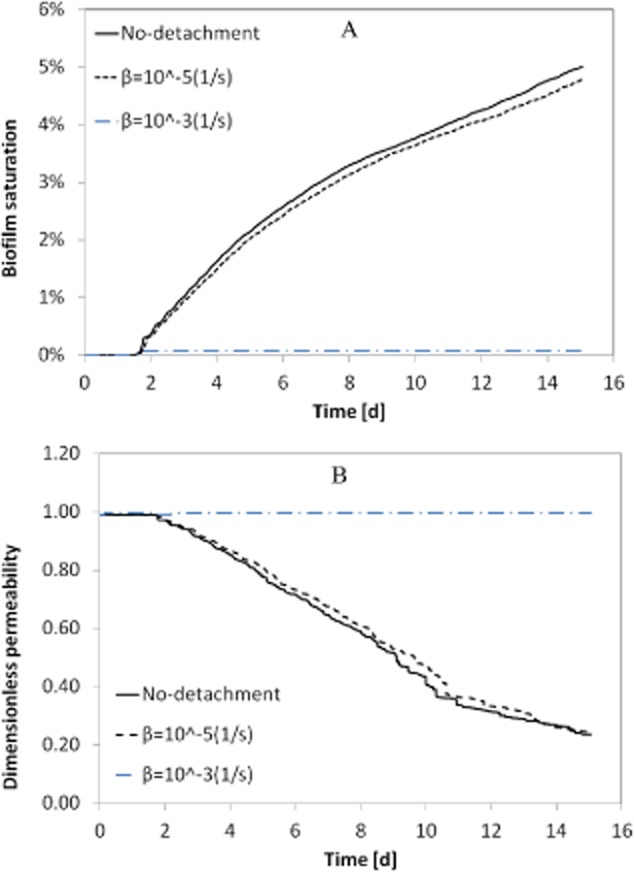
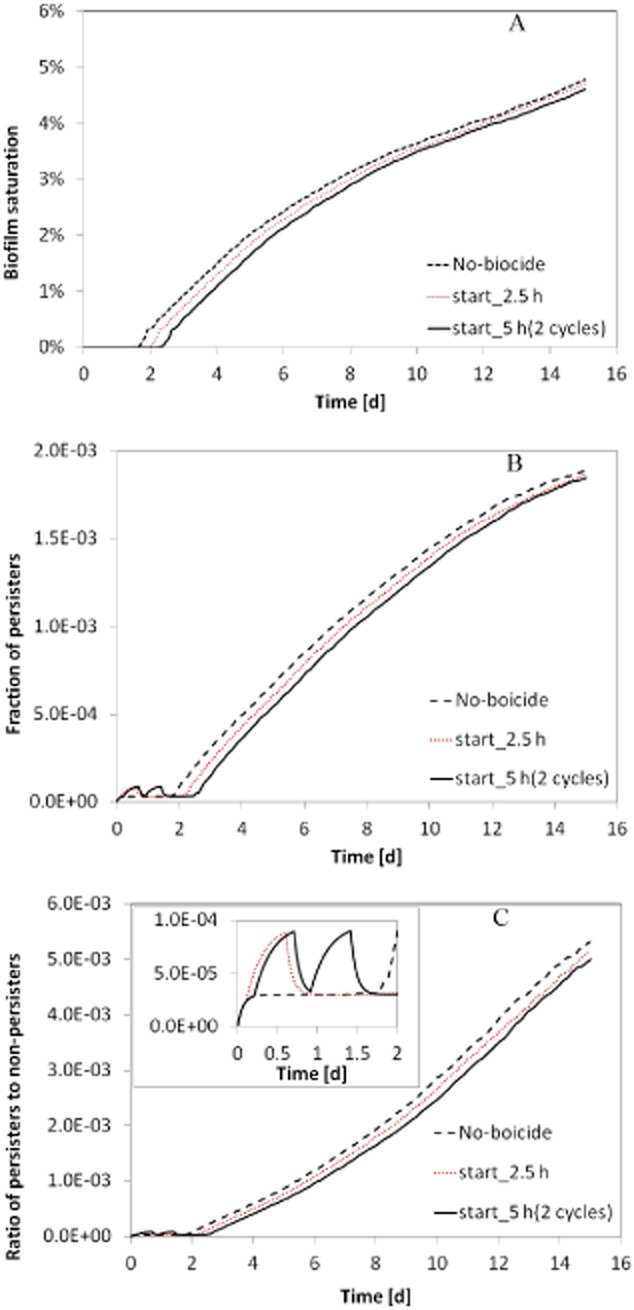
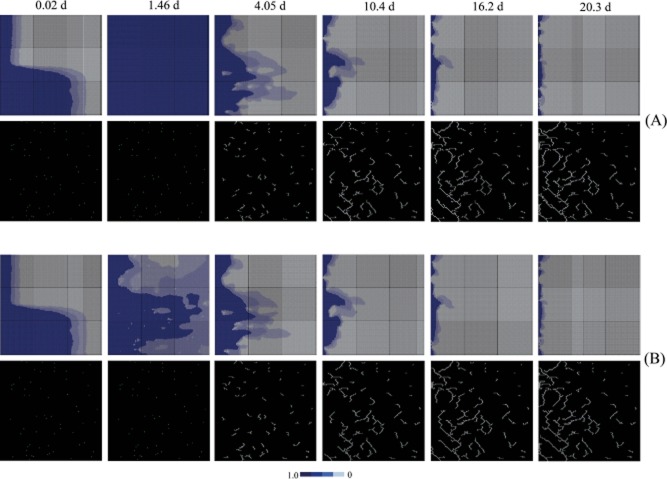
Biofilm growth in subsurface porous media, and its treatment with biocides (antimicrobial agents), involves a complex interaction of biogeochemical processes which provide non-trivial mathematical modelling challenges. Although there are literature reports of mathematical models to evaluate biofilm tolerance to biocides, none of these models have investigated biocide treatment of biofilms growing in interconnected porous media with flow. In this paper, we present a numerical investigation using a pore network model of biofilm growth, formation damage and biocide treatment. The model includes three phases (aqueous, adsorbed biofilm, and solid matrix), a single growth-limiting nutrient and a single biocide dissolved in the water. Biofilm is assumed to contain a single species of microbe, in which each cell can be a viable persister, a viable non-persister, or non-viable (dead). Persisters describe small subpopulation of cells which are tolerant to biocide treatment. Biofilm tolerance to biocide treatment is regulated by persister cells and includes 'innate' and 'biocide-induced' factors. Simulations demonstrate that biofilm tolerance to biocides can increase with biofilm maturity, and that biocide treatment alone does not reverse biofilm-induced formation damage. Also, a successful application of biological permeability conformance treatment involving geologic layers with flow communication is more complicated than simply engineering the attachment of biofilm-forming cells at desired sites.
© 2012 The Authors. Microbial Biotechnology © 2012 Society for Applied Microbiology and Blackwell Publishing Ltd.
Figures
Similar articles
-
Formulation of Biocides Increases Antimicrobial Potency and Mitigates the Enrichment of Nonsusceptible Bacteria in Multispecies Biofilms.Appl Environ Microbiol. 2017 Mar 17;83(7):e03054-16. doi: 10.1128/AEM.03054-16. Print 2017 Apr 1. Appl Environ Microbiol. 2017. PMID: 28115386 Free PMC article.
-
Modeling of biocide action against biofilm.Bull Math Biol. 2012 Jun;74(6):1427-47. doi: 10.1007/s11538-012-9719-z. Epub 2012 Feb 9. Bull Math Biol. 2012. PMID: 22318406
-
Modelling protection from antimicrobial agents in biofilms through the formation of persister cells.Microbiology (Reading). 2005 Jan;151(Pt 1):75-80. doi: 10.1099/mic.0.27385-0. Microbiology (Reading). 2005. PMID: 15632427
-
Surviving as a Community: Antibiotic Tolerance and Persistence in Bacterial Biofilms.Cell Host Microbe. 2019 Jul 10;26(1):15-21. doi: 10.1016/j.chom.2019.06.002. Cell Host Microbe. 2019. PMID: 31295420 Free PMC article. Review.
-
Advances in the treatment of problematic industrial biofilms.World J Microbiol Biotechnol. 2017 May;33(5):97. doi: 10.1007/s11274-016-2203-4. Epub 2017 Apr 13. World J Microbiol Biotechnol. 2017. PMID: 28409363 Review.
Cited by
-
Antibacterial Effect of Low-Concentration ZnO Nanoparticles on Sulfate-Reducing Bacteria under Visible Light.Nanomaterials (Basel). 2023 Jul 9;13(14):2033. doi: 10.3390/nano13142033. Nanomaterials (Basel). 2023. PMID: 37513044 Free PMC article.
-
Microfluidic study of effects of flow velocity and nutrient concentration on biofilm accumulation and adhesive strength in the flowing and no-flowing microchannels.J Ind Microbiol Biotechnol. 2019 Jun;46(6):855-868. doi: 10.1007/s10295-019-02161-x. Epub 2019 Mar 14. J Ind Microbiol Biotechnol. 2019. PMID: 30874983
References
-
- Anderson GG, O'Toole GA. Innate and induced resistance mechanisms of bacterial biofilms. Curr Top Microbiol Immunol. 2008;322:85–105. - PubMed
-
- Beliveau D. Waterflooding viscous oil reservoirs. SPE Res Eval and Eng. 2009;12:689–701.
-
- Bennion DB. An overview of formation damage mechanisms causing a reduction in the productivity and injectivity of oil and gas producing formations. J Can Pet Technol. 2002;41:10–15.
Publication types
MeSH terms
Substances
LinkOut - more resources
Full Text Sources
Other Literature Sources
