. 2013 Mar;9(2):199-203.
doi: 10.1016/j.jalz.2012.06.005. Epub 2012 Nov 16.

Amyloid imaging and cognitive decline in nondemented oldest-old: the 90+ Study

Affiliations

Amyloid imaging and cognitive decline in nondemented oldest-old: the 90+ Study

Claudia H Kawas et al. Alzheimers Dement. 2013 Mar.

Abstract

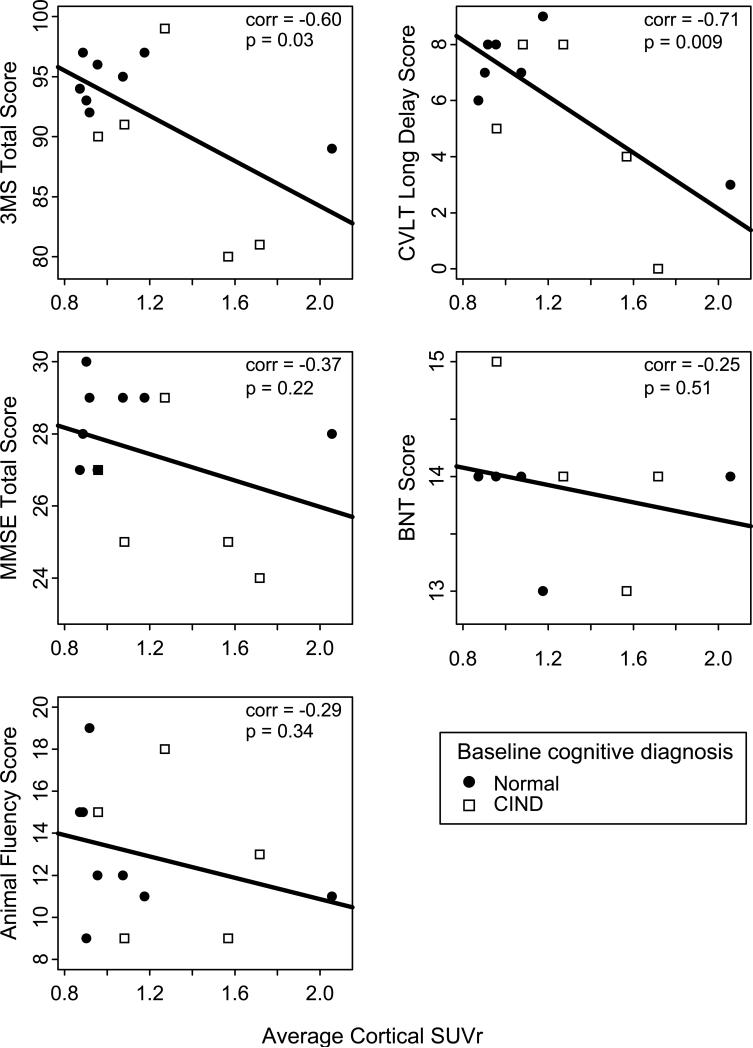
Background: The goal of this study was to examine cross-sectional and longitudinal associations between cognitive performance and beta amyloid (Aβ) load determined by florbetapir F18 positron emission tomography (PET) in nondemented oldest-old.

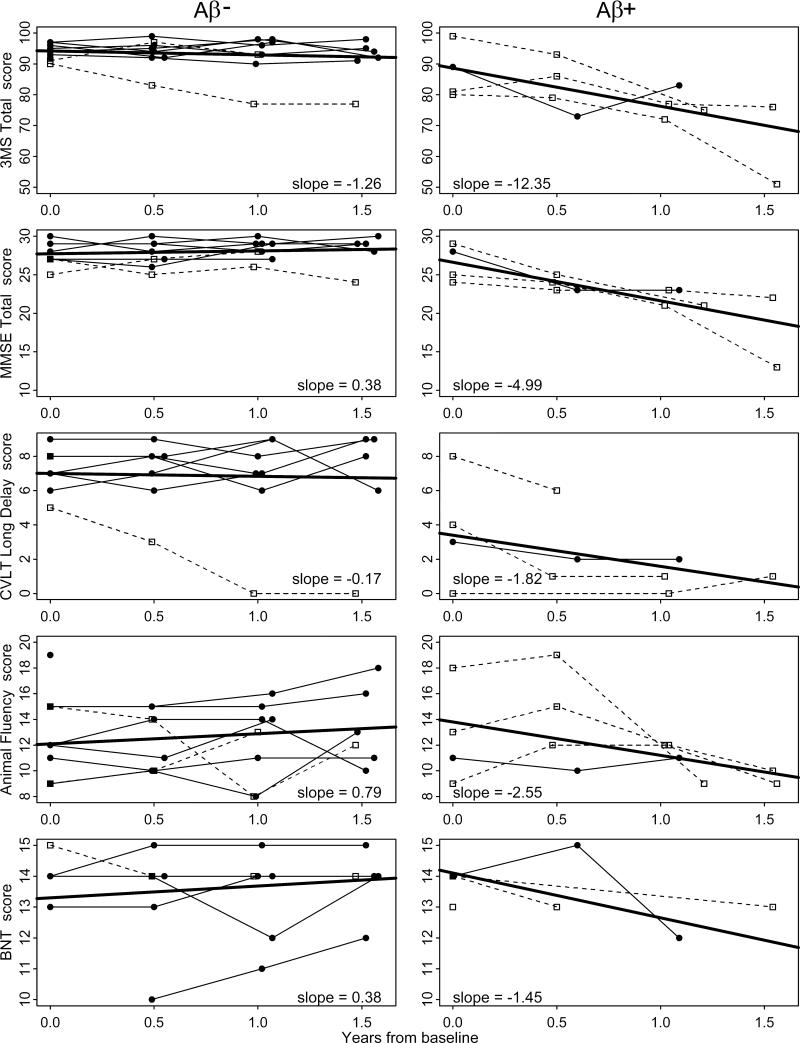
Methods: Thirteen nondemented (normal or cognitively impaired nondemented) participants (median age, 94.2 years) from The 90+ Study underwent florbetapir-PET scanning within 3 months of baseline neuropsychological testing. Amyloid load was measured with a semi-automated quantitative analysis of average cortical-to-cerebellar standardized uptake value ratio (SUVr) and a visual interpretation (Aβ- or Aβ+). Neuropsychological testing was repeated every 6 months.

Results: At baseline, SUVr correlated significantly with tests of global cognition and memory. During follow-up (median, 1.5 years), the Aβ+ group had steeper declines on most cognitive tests, particularly global cognitive measures.

Conclusion: This preliminary study suggests that greater amyloid load is associated with poorer cognition and faster cognitive decline in nondemented oldest-old. Amyloid load may identify individuals at increased risk of developing Alzheimer's disease.


Figures

Figure 1
Figure 1. Scatter plot of neuropsychological test scores at baseline versus average cortical SUVr in non-demented participants from The 90+ Study
3MS = modified Mini-Mental State Exam; MMSE = Mini-Mental State Exam; CVLT = California Verbal Learning Test; BNT = Boston Naming Test; CIND = cognitive impairment no dementia; corr = Pearson correlation; SUVr = standardized uptake value ratio Scatter plots show people with baseline cognitive diagnosis of ‘normal’ (closed circles) and ‘cognitive impairment no dementia’ (open squares).
Figure 2
Figure 2. Longitudinal trajectories of neuropsychological tests in Aβ- and Aβ+ non-demented participants from The 90+ Study
Abbreviations: Aβ- = low amyloid load according to median visual score (0,1) ; Aβ+ = high amyloid load according to median visual score (2,3,4); 3MS = modified Mini-Mental State Exam; MMSE = Mini-Mental State Exam; CVLT = California Verbal Learning Test; BNT = Boston Naming Test. Trajectories are for people with baseline cognitive diagnosis of ‘normal’ (closed circles) and ‘cognitive impairment no dementia’ (open squares). Slopes indicate the average yearly rate of change in cognitive tests (solid thick lines).

Similar articles

Cited by

References

    1. Klunk WE, Engler H, Nordberg A, et al. Imaging brain amyloid in Alzheimer's disease with Pittsburgh Compound-B. Annals of neurology. 2004;55:306–319. - PubMed
    1. Clark CM, Schneider JA, Bedell BJ, et al. Use of florbetapir-PET for imaging beta-amyloid pathology. JAMA. 2011;305:275–283. - PMC - PubMed
    1. Jack CR, Jr., Knopman DS, Jagust WJ, et al. Hypothetical model of dynamic biomarkers of the Alzheimer's pathological cascade. Lancet Neurol. 2010;9:119–128. - PMC - PubMed
    1. Morris JC, Roe CM, Grant EA, et al. Pittsburgh compound B imaging and prediction of progression from cognitive normality to symptomatic Alzheimer disease. Archives of neurology. 2009;66:1469–1475. - PMC - PubMed
    1. Corrada MM, Brookmeyer R, Paganini-Hill A, Berlau D, Kawas CH. Dementia incidence continues to increase with age in the oldest old: the 90+ study. Annals of neurology. 2010;67:114–121. - PMC - PubMed

Publication types