Unsealed tubewells lead to increased fecal contamination of drinking water
- PMID: 23165714
- PMCID: PMC3612880
- DOI: 10.2166/wh.2012.102
Unsealed tubewells lead to increased fecal contamination of drinking water
Abstract
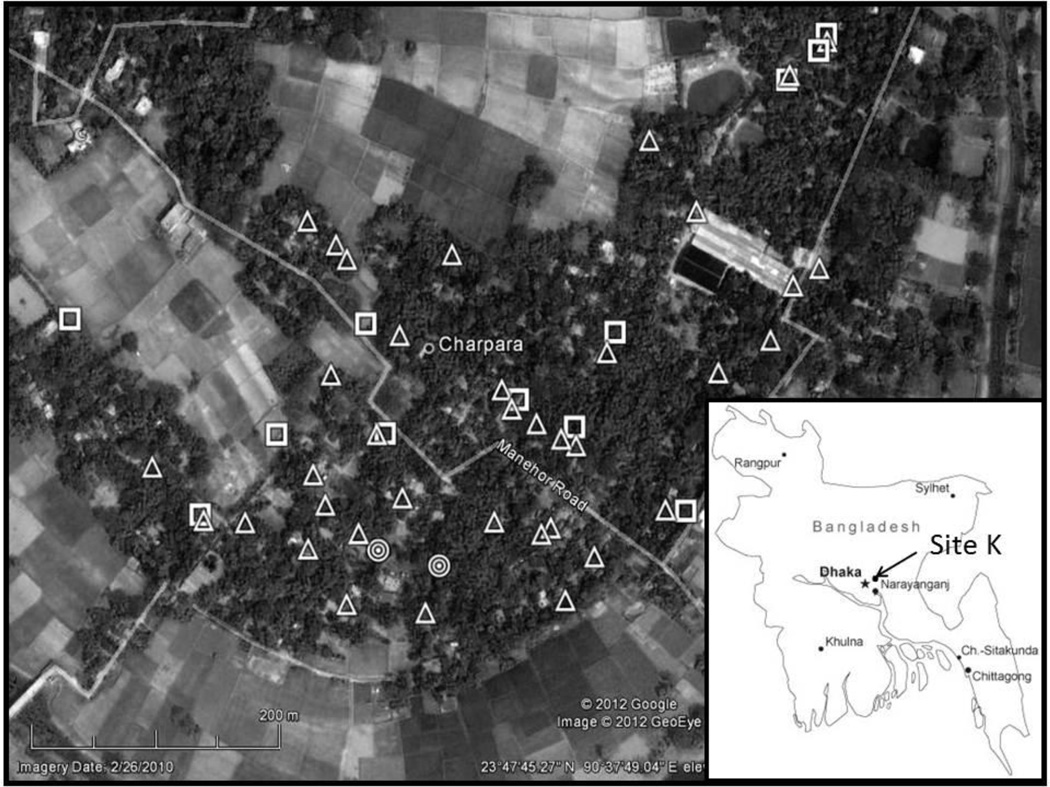
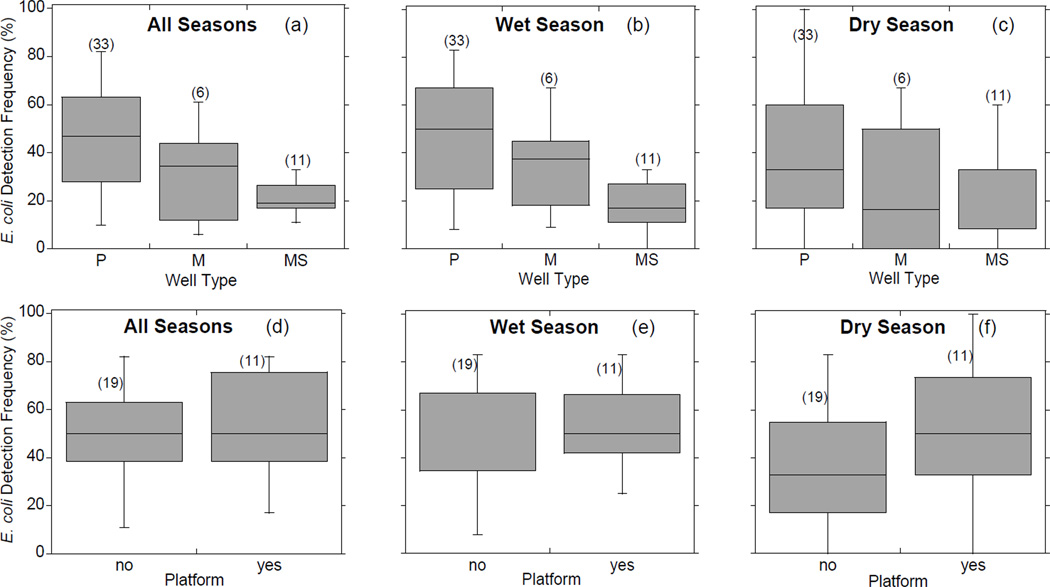
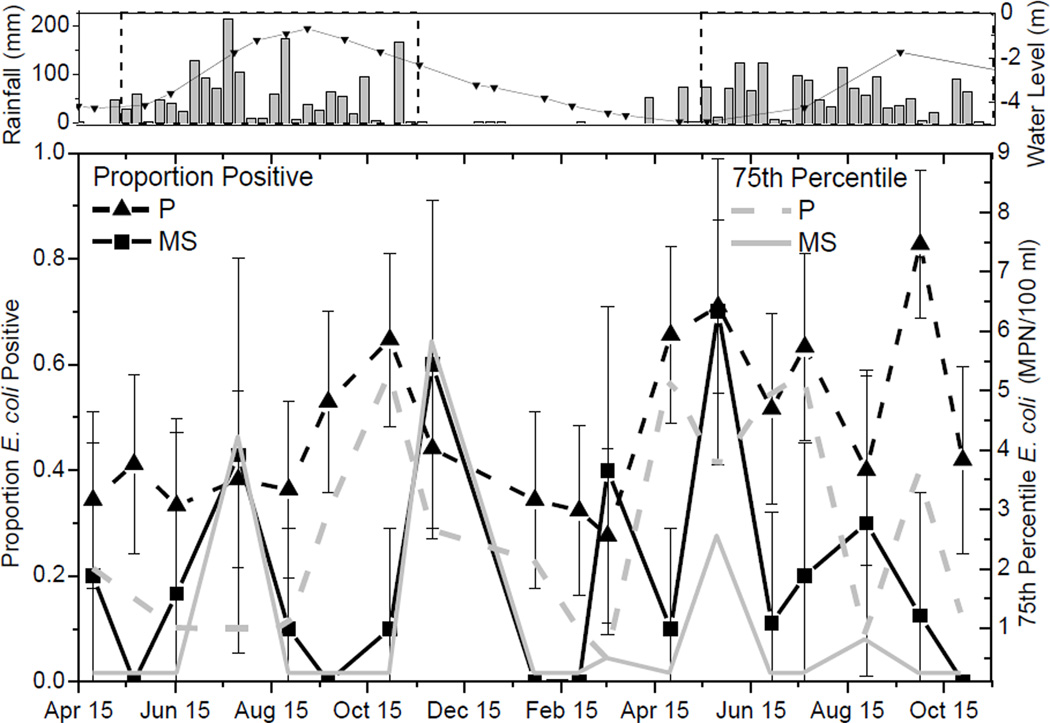
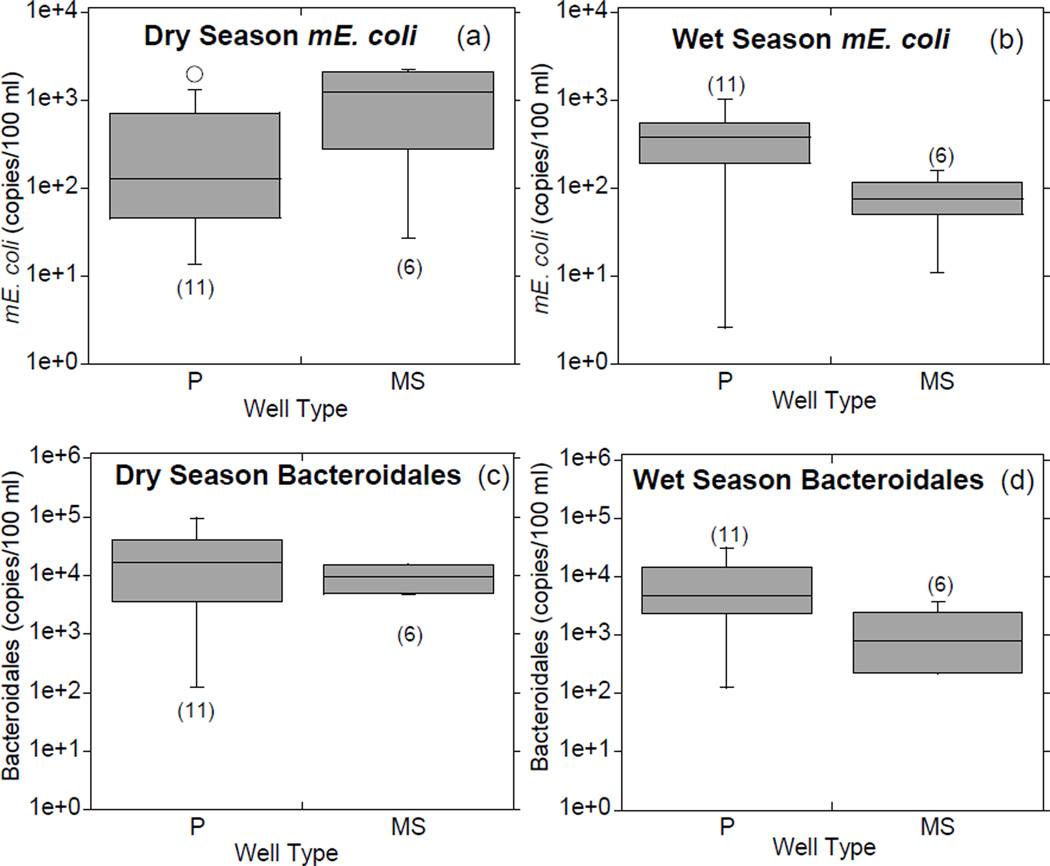
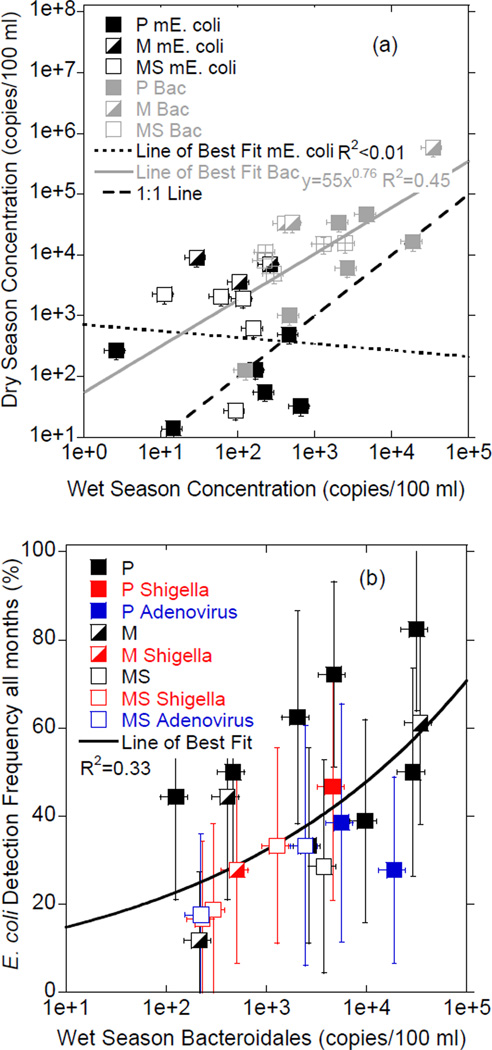
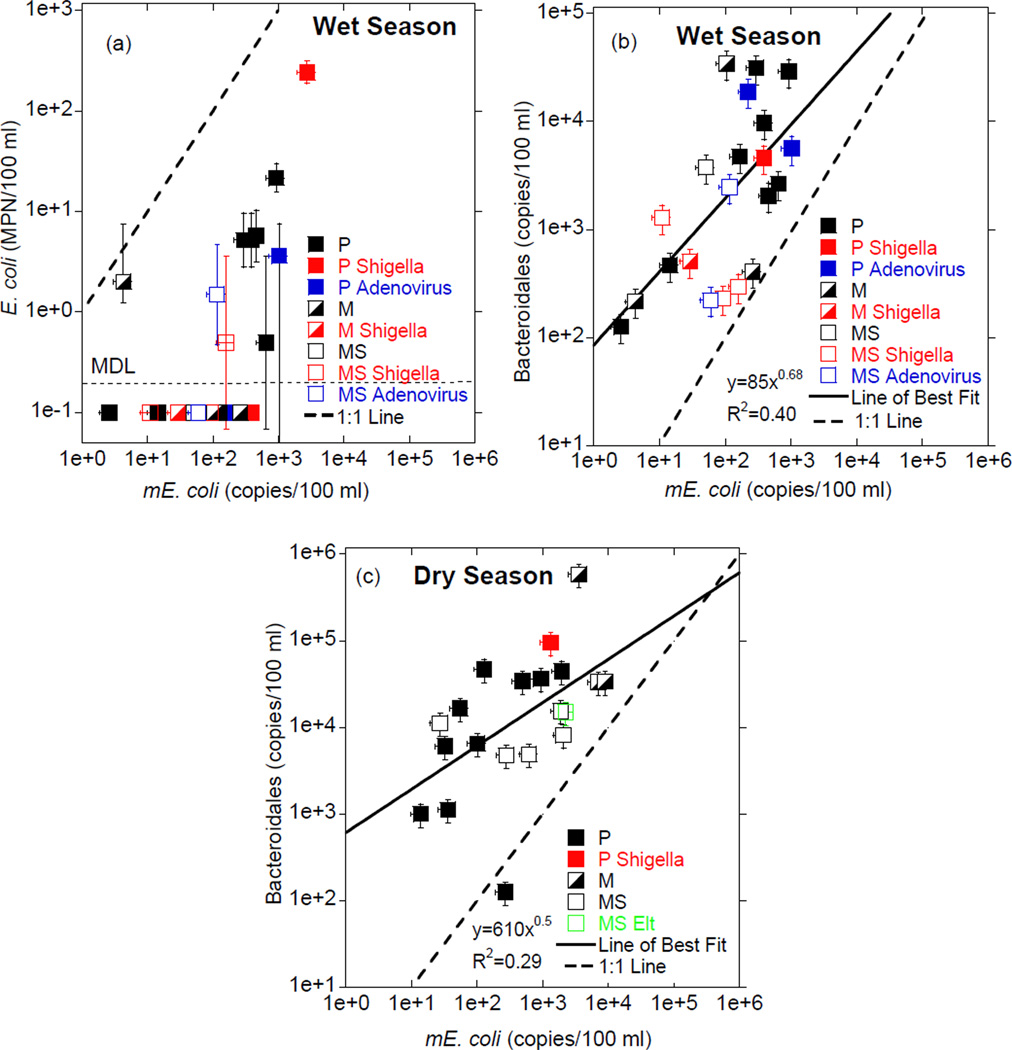
Bangladesh is underlain by shallow aquifers in which millions of drinking water wells are emplaced without annular seals. Fecal contamination has been widely detected in private tubewells. To evaluate the impact of well construction on microbial water quality 35 private tubewells (11 with intact cement platforms, 19 without) and 17 monitoring wells (11 with the annulus sealed with cement, six unsealed) were monitored for culturable Escherichia coli over 18 months. Additionally, two 'snapshot' sampling events were performed on a subset of wells during late-dry and early-wet seasons, wherein the fecal indicator bacteria (FIB) E. coli, Bacteroidales and the pathogenicity genes eltA (enterotoxigenic E. coli; ETEC), ipaH (Shigella) and 40/41 hexon (adenovirus) were detected using quantitative polymerase chain reaction (qPCR). No difference in E. coli detection frequency was found between tubewells with and without platforms. Unsealed private wells, however, contained culturable E. coli more frequently and higher concentrations of FIB than sealed monitoring wells (p < 0.05), suggestive of rapid downward flow along unsealed annuli. As a group the pathogens ETEC, Shigella and adenovirus were detected more frequently (10/22) during the wet season than the dry season (2/20). This suggests proper sealing of private tubewell annuli may lead to substantial improvements in microbial drinking water quality.
Figures
Similar articles
-
Can Sanitary Inspection Surveys Predict Risk of Microbiological Contamination of Groundwater Sources? Evidence from Shallow Tubewells in Rural Bangladesh.Am J Trop Med Hyg. 2017 Mar;96(3):561-568. doi: 10.4269/ajtmh.16-0489. Epub 2017 Apr 6. Am J Trop Med Hyg. 2017. PMID: 28115666 Free PMC article.
-
Microbial contamination of drinking water from risky tubewells situated in different hydrological regions of Bangladesh.Int J Hyg Environ Health. 2017 May;220(3):621-636. doi: 10.1016/j.ijheh.2016.12.007. Epub 2016 Dec 29. Int J Hyg Environ Health. 2017. PMID: 28094204
-
High levels of faecal contamination in drinking groundwater and recreational water due to poor sanitation, in the sub-rural neighbourhoods of Kinshasa, Democratic Republic of the Congo.Int J Hyg Environ Health. 2018 Apr;221(3):400-408. doi: 10.1016/j.ijheh.2018.01.003. Epub 2018 Jan 10. Int J Hyg Environ Health. 2018. PMID: 29396027
-
Deep tubewell use is associated with increased household microbial contamination in rural Bangladesh: Results from a prospective cohort study among households in rural Bangladesh.Environ Pollut. 2023 May 1;324:121401. doi: 10.1016/j.envpol.2023.121401. Epub 2023 Mar 6. Environ Pollut. 2023. PMID: 36889659 Free PMC article.
-
Influence of Climate Extremes and Land Use on Fecal Contamination of Shallow Tubewells in Bangladesh.Environ Sci Technol. 2016 Mar 1;50(5):2669-76. doi: 10.1021/acs.est.5b05193. Epub 2016 Feb 19. Environ Sci Technol. 2016. PMID: 26844955 Free PMC article.
Cited by
-
Child Melioidosis Deaths Caused by Burkholderia pseudomallei-Contaminated Borehole Water, Vietnam, 2019.Emerg Infect Dis. 2022 Aug;28(8):1689-1693. doi: 10.3201/eid2808.220113. Epub 2022 Jun 13. Emerg Infect Dis. 2022. PMID: 35697339 Free PMC article.
-
Can Sanitary Inspection Surveys Predict Risk of Microbiological Contamination of Groundwater Sources? Evidence from Shallow Tubewells in Rural Bangladesh.Am J Trop Med Hyg. 2017 Mar;96(3):561-568. doi: 10.4269/ajtmh.16-0489. Epub 2017 Apr 6. Am J Trop Med Hyg. 2017. PMID: 28115666 Free PMC article.
-
Do Sanitation Improvements Reduce Fecal Contamination of Water, Hands, Food, Soil, and Flies? Evidence from a Cluster-Randomized Controlled Trial in Rural Bangladesh.Environ Sci Technol. 2018 Nov 6;52(21):12089-12097. doi: 10.1021/acs.est.8b02988. Epub 2018 Oct 12. Environ Sci Technol. 2018. PMID: 30256095 Free PMC article. Clinical Trial.
-
Perinatal colonization with extended-spectrum beta-lactamase-producing and carbapenem-resistant Gram-negative bacteria among home births in Bangladesh.medRxiv [Preprint]. 2025 May 15:2025.05.14.25327637. doi: 10.1101/2025.05.14.25327637. medRxiv. 2025. PMID: 40463574 Free PMC article. Preprint.
-
Drinking water quality and public health in Southwestern Saudi Arabia: The need for a national monitoring program.J Family Community Med. 2015 Jan-Apr;22(1):19-24. doi: 10.4103/2230-8229.149581. J Family Community Med. 2015. PMID: 25657607 Free PMC article.
References
-
- Abbaszadegan M, LeChevallier M, Gerba CP. Occurrence of viruses in U.S. groundwaters. J. Am. Water Works Assoc. 2003;95:107–120.
-
- Borchardt MA, Bradbury KR, Alexander EC, Jr, Kolberg RJ, Alexander SC, Archer JR, Braatz LA, Forest BM, Green JA, Spencer SK. Norovirus Outbreak Caused by a New Septic System in a Dolomite Aquifer. Ground Water. 2011;49:85–97. - PubMed
-
- DeNovio NM, Saiers JE, Ryan JN. Colloid movement in unsaturated porous media: Recent advances and future directions. Vadose Zone J. 2004;3:338–351.
-
- Embrey SS, Runkle DL. Microbial Quality of the Nation’s Ground-Water Resources 1993–2004. National Water-Quality Assessment Program Principal Aquifers. Reston, Virginia: US Geol. Survey; 2006. US Geol. Survey Scientific Investigations Report 2006-5290.
Publication types
MeSH terms
Substances
Grants and funding
LinkOut - more resources
Full Text Sources
Medical
Research Materials