. 2013 Feb 15;591(4):1001-15.
doi: 10.1113/jphysiol.2012.243485. Epub 2012 Nov 19.

CLC-3 chloride channels moderate long-term potentiation at Schaffer collateral-CA1 synapses

Affiliations

CLC-3 chloride channels moderate long-term potentiation at Schaffer collateral-CA1 synapses

Laurel M Farmer et al. J Physiol. .

Abstract

The chloride channel CLC-3 is expressed in the brain on synaptic vesicles and postsynaptic membranes. Although CLC-3 is broadly expressed throughout the brain, the CLC-3 knockout mouse shows complete, selective postnatal neurodegeneration of the hippocampus, suggesting a crucial role for the channel in maintaining normal brain function. CLC-3 channels are functionally linked to NMDA receptors in the hippocampus; NMDA receptor-dependent Ca(2+) entry, activation of Ca(2+)/calmodulin kinase II and subsequent gating of CLC-3 link the channels via a Ca(2+)-mediated feedback loop. We demonstrate that loss of CLC-3 at mature synapses increases long-term potentiation from 135 ± 4% in the wild-type slice preparation to 154 ± 7% above baseline (P < 0.001) in the knockout; therefore, the contribution of CLC-3 is to reduce synaptic potentiation by ∼40%. Using a decoy peptide representing the Ca(2+)/calmodulin kinase II phosphorylation site on CLC-3, we show that phosphorylation of CLC-3 is required for its regulatory function in long-term potentiation. CLC-3 is also expressed on synaptic vesicles; however, our data suggest functionally separable pre- and postsynaptic roles. Thus, CLC-3 confers Cl(-) sensitivity to excitatory synapses, controls the magnitude of long-term potentiation and may provide a protective limit on Ca(2+) influx.


Figures
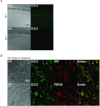
Figure 1
Figure 1. CLC-3 colocalizes with postsynaptic density 95 (PSD-95) and NMDA receptors (NMDARs) at postsynaptic sites
Cryosections were made from the hippocampus of postnatal day 42 wild-type (WT) and Clcn3−/− (KO) mice, stained for desired proteins, and imaged at ×63 magnification with ×4 zoom on a confocal microscope. A, CLC-3 is expressed throughout the CA1 region of the hippocampus in WT but not Clcn3−/− sections. B, CLC-3 immunostaining overlaps extensively with staining for the postsynaptic proteins NR1 and PSD-95 in the WT stratum radiatum. Manders’ coefficients quantifying the degree of overlap are 0.82 for the fraction of NR1 overlapping CLC-3 and 0.70 for CLC-3 overlapping NR1, with a correlation coefficient of 0.84. The fraction of PSD-95 overlapping CLC-3 is 0.67 and CLC-3 overlapping PSD-95 is 0.80, with a correlation coefficient of 0.81. Qualitative analysis of colocalization was done using ImageJ plug-in JACoP (Fabrice et al. 2006).
Figure 2
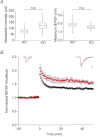
Figure 2. Long-term potentiation (LTP) is increased in Clcn3−/ slices
A, stimulation intensity (left panel) for WT (74 ± 13 μA, n= 10) and Clcn3−/− slices (124 ± 22 μA, n= 8, P= 0.06) required to produce a field excitatory postsynaptic potential (fEPSP) that is 30% of the maximal response (right panel; WT, 1.86 ± 0.18 mV, n= 10; and KO, 1.58 ± 0.13 mV, n= 8; P > 0.05). Box plots depict the mean (line across box), ± SEM (top and bottom of box) and range of the data. B, mean normalized fEPSP amplitude in response to theta burst stimulation at t= 0. Both WT (1.35 ± 4, n= 8) and Clcn3−/− slices (1.54±7, n= 10) show significant LTP at 50 min (P < 0.001, Student's paired t test). The Clcn3−/− (red traces and symbols) and WT slices (black traces and symbols) display significantly different magnitudes of LTP (P < 0.001, Student's unpaired t test). Each point is the mean ± SEM. Insets are averages of 10 fEPSPs (normalized to 1.0) for WT and Clcn3−/− slices before and after induction of LTP. Scale bar represents 0.5 and 10 ms.
Figure 3
Figure 3. Paired-pulse facilitation (PPF) is increased in Clcn3−/ slices
A, field response in CA1 stratum radiatum to paired-pulse stimulation of the Schaffer collaterals. Stimulation intensity was adjusted to 30% of the maximal evoked response. Traces shown are at a 50 ms interstimulus interval (ISI) in WT (black traces) and Clcn3−/− slices (red traces). Top traces, average fEPSPs from six consecutive sweeps. Bottom traces, average fEPSPs normalized to the peak of the first fEPSP. B, paired-pulse ratios for WT and Clcn3−/− slices, calculated as the amplitude of second/first peak (at 50 ms, WT, 1.60 ± 0.06, n= 14; and KO, 2.16 ± 0.09, n= 8). The Clcn3−/− slices display significantly stronger facilitation at all intervals between 30 and 200 ms (*P < 0.01, **P < 0.001, Student's unpaired t test). C, paired-pulse stimulation before and following 50 min of stable LTP expression in WT (n= 7) and Clcn3−/− slices (n= 4). At short ISIs, WT slices displayed a slight decrease in PPF (ISI = 30–100 ms, P < 0.05, Student's paired t test), but no significant difference appeared at longer intervals (ISI = 150–200 ms, P > 0.05, Student's paired t test). The Clcn3−/− slices showed small, inconsistent changes in PPF across ISIs, but these were significant at only one interval (ISI = 60 ms, P < 0.05; all other ISIs, P > 0.05; Student's paired t test), suggesting postsynaptic expression of LTP. Each point is the mean ± SEM.
Figure 4
Figure 4. CLC-3 is phosphorylated by Ca2+/calmodulin kinase II (CaMKII)
tsA cells were stably transfected with CLC-3 (tsA-CLC-3) or mock transfected with selection vector only (tsA-mock). A, tsA cells were fixed, permeablized, and labelled with an antibody to CLC-3. CLC-3 is expressed strongly in stably transfected tsA cells (bottom panels), while mock-transfected cells (top panels) have low endogenous expression. This is confirmed in a Western blot (right); tsA-mock cells do not show appreciable CLC-3 protein compared with tsA-CLC-3 cells. B, α-CLC-3 was incubated with protein A-conjugated magnetic Dynabeads and used to immunoprecipitate (IP) CLC-3 from tsA cells. We were able to immunoprecipitate CLC-3 from tsA-CLC-3 lysate but not from tsA-mock cells. C, CLC-3 is phosphorylated by CaMKII in vitro. Immunoprecipitated CLC-3 was incubated with activated CaMKII for 30 min, run out with SDS-PAGE, and probed for phosphorylation with an α-phosphoserine antibody. In the absence of kinase, there is negligible phosphorylation of the precipitated protein.
Figure 5
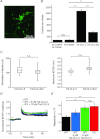
Figure 5. Application of the Tat-peptide Tat-CLC-3107−116 to a WT slice mimics increased LTP in adult Clcn3−/− slices
A, uptake of fluorescein-labelled Tat-CLC-3scr into cultured neurons. Cells displayed strong uptake within 15 min. B, in vitro phosphorylation of Tat-peptides by CaMKII using 32P-labelled ATP. When kinase or peptides are not included in the reaction mixture, there is no difference in baseline counts per minute (80 ± 4 c.p.m., n= 3; 85 ± 13 c.p.m., n= 3; P > 0.05, Student's unpaired t test), measured by a scintillation counter. Addition of Tat-CLC-3107−116 results in a 12-fold increase in 32P counts (1077 ± 51 c.p.m., n= 3; ***P < 0.001) compared with the no-peptide condition. Scrambled peptide also increases 32P counts from baseline (350 ± 33 c.p.m., n= 3; **P < 0.01) but significantly less than Tat-CLC-3107−116 (***P < 0.001). All bars are the average of three experiments ± SEM. C, stimulation intensity (left) for WT slices with 10 μm Tat-CLC-3107−116 (118 ± 18 μA, n= 6) and WT slices with 10 μm Tat-CLC-3scr (105 ± 9 μA, n= 13; P > 0.05) required to produce an fEPSP that is 30% of the maximal response (right; Tat-CLC-3107−116, 2.19 ± 0.14 mV, n= 6; and Tat-CLC-3scr, 2.57 ± 0.16 mV, n= 13; P > 0.05). Two different scrambled peptides were tested with the same result, so these data are combined. Box plots depict the mean (line across box), ± SEM (top and bottom of box) and range of the data. Time course (D) and average magnitude of LTP (E) in WT slices with 0, 5 and 10 μm Tat-CLC-3107−116 compared with Clcn3−/− slices (from left to right: 1.33 ± 0.04, n= 10; 1.43 ± 0.06, n= 4; 1.55 ± 0.06, n= 6; and 1.58 ± 0.07, n= 8; **P < 0.01, ***P < 0.001, Student's unpaired t test). At 10 μm, Tat-CLC-3107−116 produces LTP that is not significantly different from that in Clcn3−/− slices (P > 0.05).
Figure 6
Figure 6. Tat-CLC-3107−116 specifically blocks the postsynaptic interaction of CLC-3 and CaMKII
A, application of 10 μm Tat-CLC-3scr to a WT slice results in LTP that is not significantly different from that in WT slices alone (1.35 ± 0.05, n= 6; P > 0.05, Student's unpaired t test). B, 10 μm Tat-CLC-3107−116 does not alter Clcn3−/− LTP expression (1.54 ± 0.10, n= 5; P > 0.05), suggesting that it does not interfere with CaMKII phosphorylation of other substrates important for LTP. C, summary of LTP magnitudes in A and B, measured during the last 10 min of recording. D, presynaptic release is not significantly changed compared with WT slices alone (1.60 ± 0.06, n= 14) for WT slices with application of Tat-CLC-3107−116 (1.57 ± 0.04, n= 6; P > 0.05) or Tat-CLC-3scr (1.58 ± 0.06, n= 6; P > 0.05). In addition, facilitation measured in Clcn3−/− slices treated with Tat-CLC-3107−116 (2.05 ± 0.15, n= 5) is not significantly different from Clcn3−/− slices alone (2.16 ± 0.09, n= 8; P > 0.05), suggesting a purely postsynaptic action of Tat-CLC-3107−116 on LTP. Comparisons (Student's unpaired t test) were carried out for all ISIs, but reported for only ISI = 50 ms for brevity.
Figure 7
Figure 7. Model of CLC-3 regulation of LTP
Left side, at a WT synapse in a mature animal, Ca2+ influx through the NMDAR activates CaMKII, which subsequently phosphorylates/gates CLC-3. The Cl flux through CLC-3 results in shunting of membrane potential, reduces depolarization and promotes Mg2+ block of the NMDAR, thereby exerting negative feedback on the Ca2+ transient at the synapse. This moderates the amount of potentiation that the synapse undergoes. Right side, at a Clcn3−/− synapse, there is no regulation of Ca2+ influx through NMDARs by CLC-3. This leads to addition of excessive AMPA receptors (or changes in AMPA receptor conductance or distribution) and thus greater LTP for an equivalent stimulus.

Similar articles

Cited by

References

    1. Ahmadian G, Ju W, Liu L, Wyszynski M, Lee SH, Dunah AW, Taghibiglou C, Wang Y, Lu J, Wong TP, Sheng M, Wang YT. Tyrosine phosphorylation of GluR2 is required for insulin-stimulated AMPA receptor endocytosis and LTD. EMBO J. 2004;23:1040–1050. - PMC - PubMed
    1. Ahmed MS, Siegelbaum SA. Recruitment of N-type Ca2+ channels during LTP enhances low release efficacy of hippocampal CA1 perforant path synapses. Neuron. 2009;63:372–385. - PMC - PubMed
    1. Albensi BC, Oliver DR, Toupin J, Odero G. Electrical stimulation protocols for hippocampal synaptic plasticity and neuronal hyper-excitability: are they effective or relevant. Exp Neurol. 2007;204:1–13. - PubMed
    1. Allen D, Bond CT, Lujan R, Ballesteros-Merino C, Lin MT, Wang K, Klett N, Watanabe M, Shigemoto R, Stackman RW, Jr, Maylie J, Adelman JP. The SK2-long isoform directs synaptic localization and function of SK2-containing channels. Nat Neurosci. 2011;14:744–749. - PMC - PubMed
    1. Bats C, Groc L, Choquet D. The interaction between Stargazin and PSD-95 regulates AMPA receptor surface trafficking. Neuron. 2007;53:719–734. - PubMed

Publication types

MeSH terms

LinkOut - more resources