. 2013 Feb 1;591(3):609-25.
doi: 10.1113/jphysiol.2012.238014. Epub 2012 Nov 19.

Mammalian target of rapamycin signalling modulates amino acid uptake by regulating transporter cell surface abundance in primary human trophoblast cells

Affiliations

Mammalian target of rapamycin signalling modulates amino acid uptake by regulating transporter cell surface abundance in primary human trophoblast cells

Fredrick J Rosario et al. J Physiol. .

Abstract

Abnormal fetal growth increases the risk for perinatal complications and predisposes for the development of obesity, diabetes and cardiovascular disease later in life. Emerging evidence suggests that changes in placental amino acid transport directly contribute to altered fetal growth. However, the molecular mechanisms regulating placental amino acid transport are largely unknown. Here we combined small interfering (si) RNA-mediated silencing approaches with protein expression/localization and functional studies in cultured primary human trophoblast cells to test the hypothesis that mammalian target of rapamycin complex 1 (mTORC1) and 2 (mTORC2) regulate amino acid transporters by post-translational mechanisms. Silencing raptor (inhibits mTORC1) or rictor (inhibits mTORC2) markedly decreased basal System A and System L amino acid transport activity but had no effect on growth factor-stimulated amino acid uptake. Simultaneous inhibition of mTORC1 and 2 completely inhibited both basal and growth factor-stimulated amino acid transport activity. In contrast, mTOR inhibition had no effect on serotonin transport. mTORC1 or mTORC2 silencing markedly decreased the plasma membrane expression of specific System A (SNAT2, SLC38A2) and System L (LAT1, SLC7A5) transporter isoforms without affecting global protein expression. In conclusion, mTORC1 and mTORC2 regulate human trophoblast amino acid transporters by modulating the cell surface abundance of specific transporter isoforms. This is the first report showing regulation of amino acid transport by mTORC2. Because placental mTOR activity and amino acid transport are decreased in human intrauterine growth restriction our data are consistent with the possibility that dysregulation of placental mTOR plays an important role in the development of abnormal fetal growth.


Figures

Figure 1
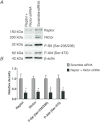
Figure 1. Silencing efficiency
A and B, effect of raptor silencing on raptor protein expression and mTORC1 activity. A, representative western blots of raptor (n= 6), phosphorylated S6 kinase (Thr-389) (n= 5), total S6 kinase (n= 6), phosphorylated 4EBP-1 (Thr-37/46) (n= 4), total 4EBP-1 (n= 4), phosphorylated S6 ribosomal protein (Ser-235/236) (n= 4) and total S6 ribosomal protein (n= 4) expression in cell lysates of scramble control, scramble siRNA and raptor silenced cells. Equal loading was performed. B, summary of the western blot data. Values are given as means + SEM. Means without a common letter are statistically different by one-way ANOVA with Tukey–Kramer multiple comparisons post hoc test (P < 0.05). C and D, effect of rictor silencing on rictor protein expression and mTORC2 activity. C, representative western blots of rictor (n= 6), phosphorylated Akt (Ser-473) (n= 3) and total Akt (n= 3) expression in cell lysates of scramble control, scramble siRNA and rictor silenced cells. Equal loading was performed. D, summary of the western blot data. Values are given as means + SEM. Means without a common letter are statistically different by one-way ANOVA with Tukey–Kramer multiple comparisons post hoc test (P < 0.05).
Figure 2
Figure 2. Effect of raptor plus rictor silencing on raptor and rictor protein expression and mTOR activity
A, representative western blots of raptor (n= 4), rictor (n= 4), phosphorylated S6 ribosomal protein (Ser-235/236) (n= 4) and phosphorylated Akt (Ser-473) (n= 4) expression in cell lysates of scramble siRNA and raptor+rictor silenced cells. Equal loading was performed. B, summary of the western blot data. Values are given as means + SEM. *P < 0.05 versus control; unpaired Student's t test.
Figure 3
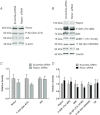
Figure 3. Cross-talk between mTORC1 and mTORC2 signalling pathways
A and C, effect of raptor silencing on rictor protein expression and mTORC2 activity. A, representative western blots of rictor (n= 4), phosphorylated Akt (Ser-473) (n= 8) and total Akt (n= 4) expression in cell lysates of scramble siRNA and raptor silenced cells. Equal loading was performed. C, summary of the western blot data. Values are given as means + SEM. None of the differences between raptor and scramble siRNA were statistically significant; unpaired Student's t test. B and D, effect of rictor silencing on raptor protein expression and mTORC1 activity. B, representative western blots of raptor (n= 8), phosphorylated S6 kinase (Thr-389) (n= 8), total S6 kinase (n= 4), phosphorylated 4EBP-1 (Thr-37/46) (n= 4), phosphorylated S6 ribosomal protein (Ser-235/236) (n= 8) and total S6 ribosomal protein (n= 4) expression in cell lysates of scramble siRNA and rictor silenced cells. Equal loading was performed. D, summary of the western blot data. Values are given as means + SEM. None of the differences between rictor and scramble siRNA were statistically significant; unpaired Student's t test.
Figure 4
Figure 4. mTOR regulation of System A and L amino acid transport activity
A and B, time course of amino acid uptake in trophoblast cells. System L activity (A) was measured as the BCH-inhibitable uptake of [3H]leucine, and System A activity (B) was determined as the Na+-dependent uptake of [14C]MeAIB. Uptakes were linear for at least 12 min (System L: r= 0.91, P < 0.0001, n= 9; System A: r= 0.81, P < 0.0001, n= 6; Spearman's rho). Values are given as means + SEM. C–F, effect of mTOR inhibition on trophoblast basal and growth factor-stimulated amino acid uptake. Inhibition of mTOR by 100 nm rapamycin decreased the basal activity of System L (C) and System A (D) transporters in cultured human primary trophoblast cells. Addition of insulin (5.8 ng ml−1) and IGF-I (300 ng ml−1) to the cell culture media stimulated the System L (E) and System A (F) transporter in control cells. The stimulatory effect of growth factor (GF) (defined as the difference between uptake in growth factor-containing and control media) on System A and System L activity was not significantly affected by the rapamycin. Values are means + SEM; n= 9 for System L and n= 4 for System A. *P < 0.05 versus control; unpaired Student's t test.
Figure 5
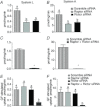
Figure 5. Role of mTORC1 and mTORC2 in regulating System A and System L amino acid uptake in trophoblast cells
A and B, effect of silencing raptor (mTORC1 inhibition) or rictor (mTORC2 inhibition) on System L (A) and System A (B) transporter activity. Values are means + SEM; n= 5 for System L and System A. Means without a common letter differ P < 0.05 by RMANOVA with Tukey–Kramer multiple comparisons post hoc test. C and D, effect of simultaneous silencing of raptor and rictor on basal System L (C) and System A amino acid uptake (D). Values are means + SEM; n= 4. *P < 0.05 versus control; unpaired Student's t test. E and F, regulation of growth factor-stimulated amino acid uptake by mTORC1 and mTORC2. The stimulatory effect of growth factors (defined as the difference between uptake in growth factor-containing and control media) on System L (E) and System A (F) activity was not significantly influenced by raptor or rictor silencing. In contrast, simultaneous raptor and rictor silencing in trophoblast cells abolished the growth factor-stimulated Systems A and L uptake activity. Values are means + SEM; n= 5 for System L and System A. Means without a common letter differ significantly (P < 0.05) by RMANOVA with Tukey–Kramer multiple comparisons post hoc test.
Figure 6
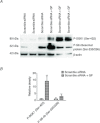
Figure 6. Activation of mTORC1 and 2 by growth factors
A, representative western blot for phospho-SGK1 (readout for mTORC2 signalling) and phospho-ribosomal protein S6 (mTORC1 readout). B, summary of data. Values are means + SEM; n= 3. *P < 0.05 versus control; unpaired Student's t test.
Figure 7
Figure 7. Global protein expression of System L and System A amino acid transporter isoforms in total cell lysates in response to raptor or rictor silencing
Representative western blots are shown for isoforms of System L (A): L-type amino acid transporter (LAT1 (45 kDa), LAT2 (30 and 50 kDa)), and System A (C): sodium-coupled neutral amino acid transporter (SNAT1 (52 kDa), SNAT2 (52 kDa), SNAT4 (54 kDa)), and 4F2hc (80 kDa), in cell lysates of control, scramble siRNA and raptor or rictor silenced cells. Equal loading was performed. The histograms (B and D) summarize the western blot data from scramble control (n= 5), scramble siRNA (n= 5) and raptor or rictor (n= 5) silenced trophoblast cells. Values are means + SEM. No significant differences between raptor or rictor silenced cells and controls were observed (RMANOVA with Tukey–Kramer multiple comparisons post hoc test).
Figure 8
Figure 8. Protein expression of System L and System A amino acid transporter isoforms in MVMs isolated from control and raptor or rictor silenced trophoblast cells
A, representative western blots are shown for L-type amino acid transporter (LAT1 (45 kDa), LAT2 (30 and 50 kDa), 4F2hc (80 kDa)) and sodium-coupled neutral amino acid transporter (SNAT1 (52 kDa), SNAT2 (52 kDa), SNAT4 (54 kDa)) in cell lysates and MVMs of control and raptor or rictor silenced cells. Equal loading was performed. The histogram (B) shows the protein expression of transporter isoforms in total cell lysates and MVMs in response to silencing of raptor or rictor (n= 3) as compared to control cells treated with scramble siRNA (n= 3). Expression in control cells for each isoform was arbitrarily assigned a value of one and is indicated by the dotted line in the figure. Values are means + SEM; *P < 0.05 versus control; unpaired Student's t test.
Figure 9
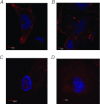
Figure 9. Cellular localization of SNAT2 protein expression in mTORC1 inhibition trophoblast cells
Trophoblast cells were transfected at 18 h in culture with scramble (A and B) or raptor (C and D) siRNA. At 90 h in culture, cells were fixed and SNAT2 expression (orange) was visualized using immunofluorescence. Nuclei were counterstained using DAPI (4′,6-diamidino-2-phenylindole) (blue). Scale bars represent 10 μm.

Similar articles

Cited by

References

    1. Alessi DR, Pearce LR, García-Martínez JM. New insights into mTOR signaling: mTORC2 and beyond. Sci Signal. 2009;2:1–4. - PubMed
    1. Ayuk PT-Y, Sibley CP, Donnai P, D'Souza S, Glazier JD. Development and polarization of cationic amino acid transporters and regulators in the human placenta. Am J Physiol Cell Physiol. 2000;278:C1162–C1171. - PubMed
    1. Cleal JK, Glazier JD, Ntani G, Crozier SR, Day PE, Harvey NC, Robinson SM, Cooper C, Godfrey KM, Hanson MA, Lewis RM. Facilitated transporters mediate net efflux of amino acids to the fetus across the basal membrane of the placental syncytiotrophoblast. J Physiol. 2011;589:987–997. - PMC - PubMed
    1. Coan PM, Vaughan OR, Sekita Y, Finn SL, Burton GJ, Constancia M, Fowden AL. Adaptations in placental phenotype support fetal growth during undernutrition of pregnant mice. J Physiol. 2010;588:527–538. - PMC - PubMed
    1. Desforges M, Lacey HA, Glazier JD, Greenwood SL, Mynett KJ, Speake PF, Sibley CP. The SNAT4 isoform of the system A amino acid transporter is expressed in human placenta. Am J Physiol Cell Physiol. 2006;290:C305–C312. - PubMed

Publication types

MeSH terms

Substances