

Responses of glomus cells to hypoxia and acidosis are uncoupled, reciprocal and linked to ASIC3 expression: selectivity of chemosensory transduction
- PMID: 23165770
- PMCID: PMC3591706
- DOI: 10.1113/jphysiol.2012.247189
Responses of glomus cells to hypoxia and acidosis are uncoupled, reciprocal and linked to ASIC3 expression: selectivity of chemosensory transduction
Abstract
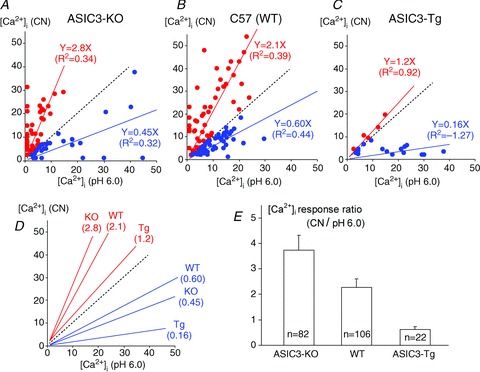
Carotid body glomus cells are the primary sites of chemotransduction of hypoxaemia and acidosis in peripheral arterial chemoreceptors. They exhibit pronounced morphological heterogeneity. A quantitative assessment of their functional capacity to differentiate between these two major chemical signals has remained undefined. We tested the hypothesis that there is a differential sensory transduction of hypoxia and acidosis at the level of glomus cells. We measured cytoplasmic Ca(2+) concentration in individual glomus cells, isolated in clusters from rat carotid bodies, in response to hypoxia ( mmHg) and to acidosis at pH 6.8. More than two-thirds (68%) were sensitive to both hypoxia and acidosis, 19% were exclusively sensitive to hypoxia and 13% exclusively sensitive to acidosis. Those sensitive to both revealed significant preferential sensitivity to either hypoxia or to acidosis. This uncoupling and reciprocity was recapitulated in a mouse model by altering the expression of the acid-sensing ion channel 3 (ASIC3) which we had identified earlier in glomus cells. Increased expression of ASIC3 in transgenic mice increased pH sensitivity while reducing cyanide sensitivity. Conversely, deletion of ASIC3 in the knockout mouse reduced pH sensitivity while the relative sensitivity to cyanide or to hypoxia was increased. In this work, we quantify functional differences among glomus cells and show reciprocal sensitivity to acidosis and hypoxia in most glomus cells. We speculate that this selective chemotransduction of glomus cells by either stimulus may result in the activation of different afferents that are preferentially more sensitive to either hypoxia or acidosis, and thus may evoke different and more specific autonomic adjustments to either stimulus.
Figures
 , 15 mmHg) and ionomycin (5 μ
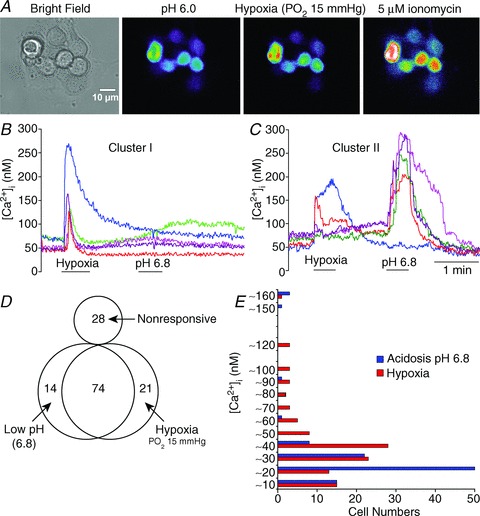
 , 15 mmHg) and acidosis (pH 6.8) in two different clusters (I and II) from a rat carotid body reveal heterogeneity and reciprocal sensitivities to the two stimuli between the two clusters and in individual cells within each cluster. B, all cells in Cluster I are more sensitive to hypoxia than to low pH. C, four of five cells in Cluster II are very sensitive to low pH 6.8 and much less sensitive to hypoxia. One cell in this cluster, however, responds well to hypoxia and not low pH. D, diagram identifies the number of non-responsive and responsive cells and their distribution in terms of responders to hypoxia, low pH, or to both out of a total of 137 glomus cells. E, number of glomus cells separated according to the magnitude of their increase in [Ca2+]i with hypoxia and acidosis. The horizontal bars indicate the number of responding cells at each decadal level of increases in [Ca2+]i from Δ 10 n
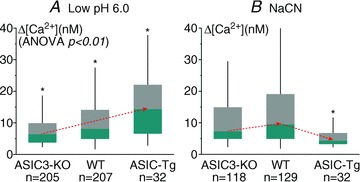
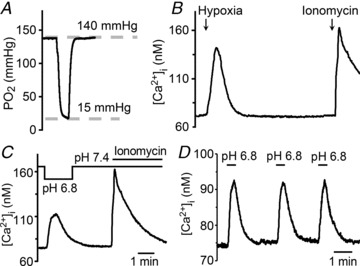
 in the bathing medium drops rapidly to hypoxic levels as low as 15 mmHg within 30 sec upon switching from the normal perfusate (
 mmHg, pH 7.4) to the hypoxic one (
 mmHg, pH 7.4). (B) Hypoxia initiates a rapid increase in [Ca2+]i. (C) Similarly a drop in pH from 7.4 to 6.8 increases [Ca2+]i. Responses to ionomycin (5 μM) were reproducible following hypoxia in (B) and following low pH in (C). (D) Responses to pH 6.8 were reproducible with repeated exposures.
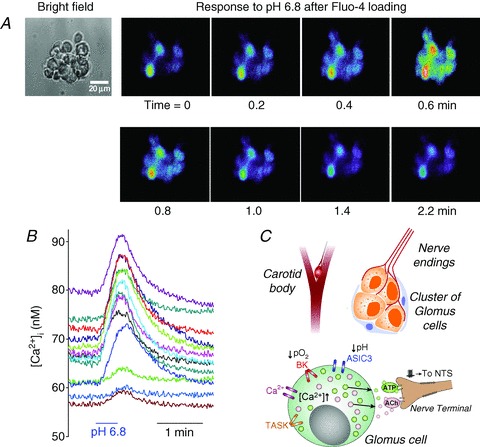
 with the release of ACh and ATP. NTS, nucleus of the tractus solitarius.
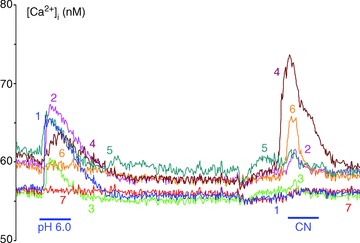
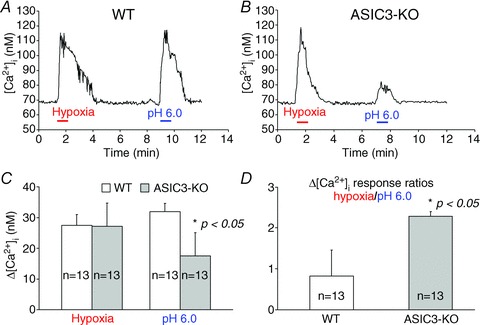
 , 15 mmHg) and to low pH (6.0) of single isolated glomus cells from WT (A) and ASIC3 KO (B). Bar graphs indicate means ± SEM of intracellular calcium responses of 13 glomus cells from WT and ASIC3 KO mice to hypoxia and to pH 6.0 (C), and the means ± SEM of the ratios of those responses (hypoxia/pH 6.0) (D). The decreased response to low pH is significant in glomus cells from ASIC3 KO mice (*P < 0.05). This and the preservation or enhancement of responses to hypoxia resulted in more than a doubling of the ratios of responses to hypoxia/pH 6.0 in ASIC3-KO compared to the ratios in WT.
Comment in
-
Responses of glomus cells to hypoxia and acidosis.J Physiol. 2013 Jul 15;591(14):3667. doi: 10.1113/jphysiol.2013.254029. J Physiol. 2013. PMID: 23858042 Free PMC article. No abstract available.
-
Reply from Y. Lu, C. A. Whiteis, K. A. Sluka, M. W. Chapleau and F. M. Abboud.J Physiol. 2013 Jul 15;591(14):3669. doi: 10.1113/jphysiol.2013.256453. J Physiol. 2013. PMID: 23858043 Free PMC article. No abstract available.
Similar articles
-
Responses of glomus cells to hypoxia and acidosis.J Physiol. 2013 Jul 15;591(14):3667. doi: 10.1113/jphysiol.2013.254029. J Physiol. 2013. PMID: 23858042 Free PMC article. No abstract available.
-
Acid-sensing ion channels contribute to transduction of extracellular acidosis in rat carotid body glomus cells.Circ Res. 2007 Nov 9;101(10):1009-19. doi: 10.1161/CIRCRESAHA.107.154377. Epub 2007 Sep 13. Circ Res. 2007. PMID: 17872465
-
Intracellular signalling in arterial chemoreceptors during acute hypoxia and glucose deprivation: role of ATP.J Physiol. 2025 Mar;603(5):1091-1107. doi: 10.1113/JP287130. Epub 2025 Feb 12. J Physiol. 2025. PMID: 39937745
-
Postnatal development of carotid body glomus cell O2 sensitivity.Respir Physiol Neurobiol. 2005 Nov 15;149(1-3):201-15. doi: 10.1016/j.resp.2005.04.009. Respir Physiol Neurobiol. 2005. PMID: 15886071 Review.
-
Neurotrophic Properties, Chemosensory Responses and Neurogenic Niche of the Human Carotid Body.Adv Exp Med Biol. 2015;860:139-52. doi: 10.1007/978-3-319-18440-1_16. Adv Exp Med Biol. 2015. PMID: 26303476 Review.
Cited by
-
TMEM16B determines cholecystokinin sensitivity of intestinal vagal afferents of nodose neurons.JCI Insight. 2019 Mar 7;4(5):e122058. doi: 10.1172/jci.insight.122058. eCollection 2019 Mar 7. JCI Insight. 2019. PMID: 30843875 Free PMC article.
-
Acid-sensing ion channel 1a activates IKCa/SKCa channels and contributes to endothelium-dependent dilation.J Gen Physiol. 2023 Feb 6;155(2):e202213173. doi: 10.1085/jgp.202213173. Epub 2022 Dec 9. J Gen Physiol. 2023. PMID: 36484717 Free PMC article.
-
Enhanced non-eupneic breathing following hypoxic, hypercapnic or hypoxic-hypercapnic gas challenges in conscious mice.Respir Physiol Neurobiol. 2014 Dec 1;204:147-59. doi: 10.1016/j.resp.2014.09.006. Epub 2014 Sep 19. Respir Physiol Neurobiol. 2014. PMID: 25242462 Free PMC article.
-
TASK inhibition by mild acidosis increases Ca2+ oscillations to mediate pH sensing in rat carotid body chemoreceptor cells.Am J Physiol Lung Cell Mol Physiol. 2023 Mar 1;324(3):L259-L270. doi: 10.1152/ajplung.00099.2022. Epub 2023 Jan 24. Am J Physiol Lung Cell Mol Physiol. 2023. PMID: 36692168 Free PMC article.
-
ASICs and cardiovascular homeostasis.Neuropharmacology. 2015 Jul;94:87-98. doi: 10.1016/j.neuropharm.2014.12.017. Epub 2015 Jan 12. Neuropharmacology. 2015. PMID: 25592213 Free PMC article. Review.
References
-
- Abudara V, Jiang RG, Eyzaguirre C. Behavior of junction channels between rat glomus cells during normoxia and hypoxia. J Neurophysiol. 2002;88:639–649. - PubMed
-
- Bamford OS, Sterni LM, Wasicko MJ, Montrose MH, Carroll JL. Postnatal maturatin of carotid body and type I cell chemoreception in the rat. Am J Physiol Lung Cell Mol Physiol. 1999;276:L875–L884. - PubMed
-
- Bright GR, Agani FH, Haque U, Overholt JL, Prabhakar NR. Heterogeneity in cytosolic calcium responses to hypoxia in carotid body cells. Brain Res. 1996;706:297–302. - PubMed
Publication types
MeSH terms
Substances
Grants and funding
LinkOut - more resources
Full Text Sources
Other Literature Sources
Molecular Biology Databases
Miscellaneous