. 2013 Feb;43(2):404-15.
doi: 10.1002/eji.201242565. Epub 2012 Dec 26.

Direct identification of rat iNKT cells reveals remarkable similarities to human iNKT cells and a profound deficiency in LEW rats

Affiliations

Direct identification of rat iNKT cells reveals remarkable similarities to human iNKT cells and a profound deficiency in LEW rats

Elisa Monzon-Casanova et al. Eur J Immunol. 2013 Feb.

Abstract

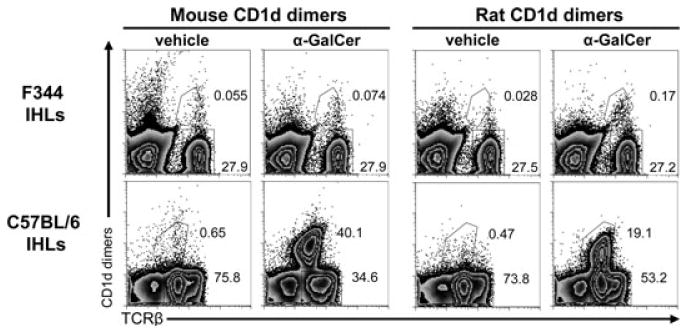
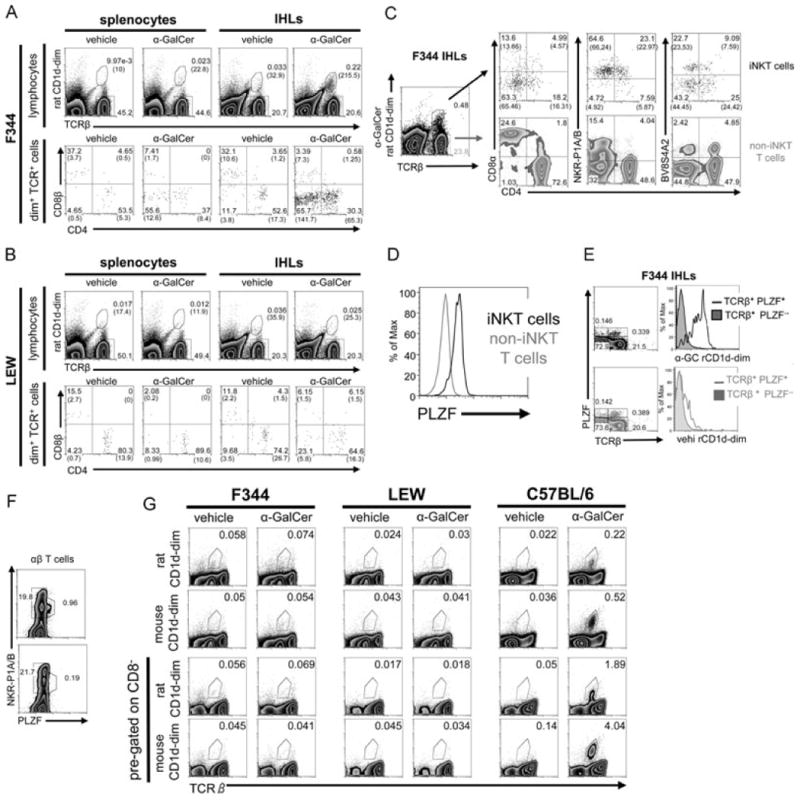
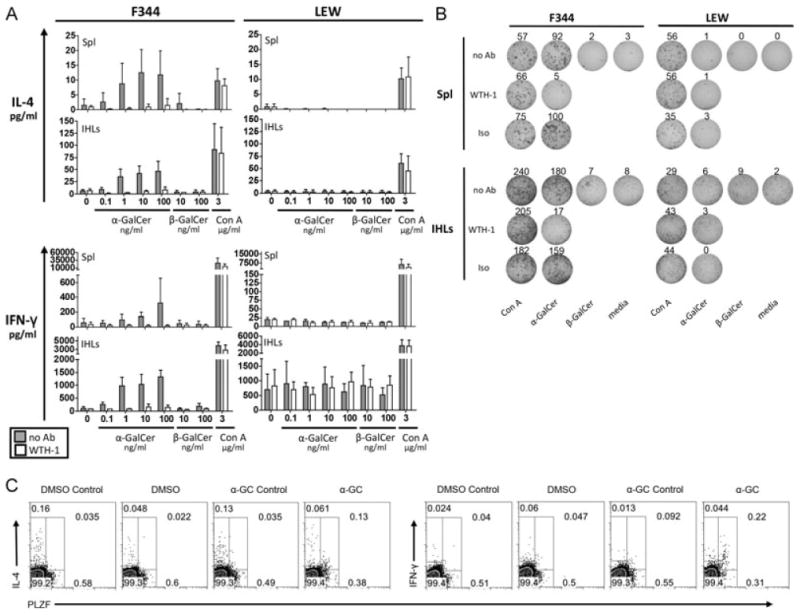
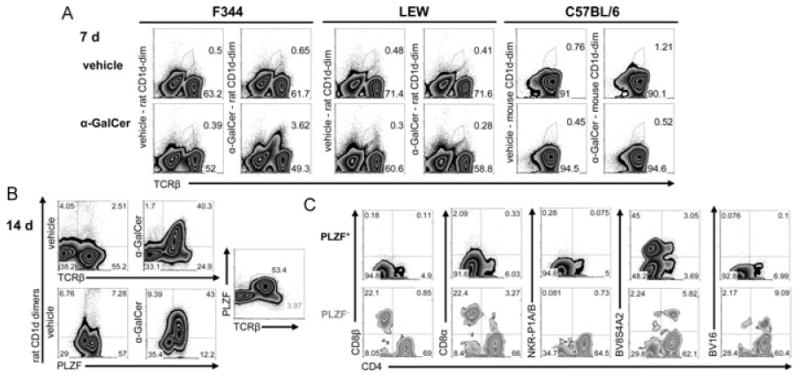
iNKT cells are a particular lymphocyte population with potent immunomodulatory capa-city; by promoting or suppressing immune responses against infections, tumors, and autoimmunity, iNKT cells are a promising target for immunotherapy. The hallmark of iNKT cells is the expression of a semiinvariant TCR (with an invariant α-chain comprising AV14 and AJ18 gene segments), which recognizes glycolipids presented by CD1d. Here, we identified iNKT cells for the first time in the rat using rat CD1d-dimers and PLZF staining. Importantly, in terms of frequencies (1.05% ± 0.52 SD of all intrahepatic αβ T cells), coreceptor expression and in vitro expansion features, iNKT cells from F344 inbred rats more closely resemble human iNKT cells than their mouse counterparts. In contrast, in LEW inbred rats, which are often used as models for organ-specific autoimmune diseases, iNKT cell numbers are near or below the detection limit. Interestingly, the usage of members of the rat AV14 gene family differed between F344 and LEW inbred rats. In conclusion, the similarities between F344 rat and human iNKT cells and the nearly absent iNKT cells in LEW rats make the rat a promising animal model for the study of iNKT cell-based therapies and of iNKT-cell biology.


Figures

Figure 1
Figure 1
Identification of rat iNKT cells. IHLs derived from F344 inbred rats or C57BL/6 inbred mice were analyzed by flow cytometry using rat and mouse CD1d dimers loaded with α-GalCer or vehicle as control. Rat and mouse TCRβ expression was also analyzed. The secondary DαM Ab used to visualize the bound dimers also stained mouse IgG-positive B cells, thus these cells were excluded in the analysis of mouse IHLs by gating out CD19+ cells, which were 23% of all IHLs. Numbers indicate the percentages of the gated cells. The data shown are representative of three independent experiments.
Figure 2
Figure 2
iNKT-cell characterization in F344 and LEW inbred rat strains. (A, B) Splenocytes and IHLs derived from (A) F344 and (B) LEW inbred rats were stained with rat CD1d dimers loaded with α-GalCer or vehicle as control, anti-TCRβ, -CD4, and -CD8β mAbs and were analyzed by flow cytometry. The number of cells included in the depicted gates per 100 000 lymphocytes is shown in brackets. (C) CD4, CD8α, NKR-P1A/B, and BV8S4A2 expression on intrahepatic F344 rat iNKT (dot plots, top) and non-iNKT T cells (density plots, bottom) was addressed by flow cytometry. The final percentages of the cells in the quadrants after substraction of the cells stained with control vehicle-CD1d dimers are shown in brackets. (D) PLZF expression by F344 iNKT and non-iNKT T cells. IHLs were stained at the surface with anti-TCRβ mAb and α-GalCer-CD1d dimers and with anti-PLZF mAb intracellularly. (E) PLZF expression and CD1d dimer binding analyzed among IHLs. Density blots show total IHLs stained with anti-TCR and anti-PLZF mAb and the gating strategy used to create the histograms shown on the right. IHLs were stained with α-GalCer-CD1d dimers (top) or with vehicle-CD1d dimers (bottom). (F) PLZF expression by αβ T cells among F344 (density plot, top) and LEW IHLs (density plot, bottom). IHLs were stained at the surface with anti-TCRβ and anti-NKR-P1A/B mAbs and intracellularly with anti-PLZF mAb. Shown are pregated TCRβ-positive events. (G) Analysis of iNKT cells in the thymus. Thymocytes from F344 and LEW rats and from C57BL/6 mice were stained with rat and mouse CD1d dimers, anti-TCRβ, and anti-CD8 mAbs and were analyzed by flow cytometry. Total thymocytes are shown in the two upper rows whereas the two lower rows depict only CD8 thymocytes. In all mouse samples, B cells were excluded from the analysis by pregating on CD19 cells. (A–G) The data shown are representative of at least three independent experiments except in (F) where the experiment shown was carried out once. Values without brackets indicate the percentages of gated cells.
Figure 3
Figure 3
Cytokine release by F344- and LEW-derived primary cells in response to α-GalCer stimulation. (A) IL-4 and IFN-γ release into the supernatant was analyzed by ELISA after 24 h of stimulation of primary splenocytes (107 cells/ml) and IHLs (2.5 × 10⁶ cells/ml) with the indicated concentrations of α-GalCer, β-GalCer or Con A in the absence (gray bars) or presence of an anti-rat CD1d monoclonal antibody (WTH-1 at 3.6 μg/ml, white bars). Data are shown as the mean + SD of results pooled from three independent experiments, each experiment performed with cells derived from individual animals. Assays with splenocytes performed in duplicate, assays with IHLs performed on single samples. (B) IL-4 secretion by F344- and LEW-derived splenocytes (106 cells/well) and IHLs (2.5 × 10⁵ cells/well) addressed by ELISPOT after 24 h of culture with α-GalCer (10 ng/ml), β-GalCer (10 ng/ml), Con A (2 μg/ml), or in medium only. The cultures with α-GalCer and Con A were also carried out in the presence of the anti-rat CD1d monoclonal antibody WTH-1 or an isotype-matched control antibody at a final concentration of 5 μg/ml. Values indicate the number of spots per well. (C) α-GalCer-induced cytokine production by PLZF+ IHLs. 106 F344 IHLs/ml were cultured for 5 h with 100 ng/ml α-GalCer, adding GolgiPlug during the last 2 h. Control stainings were carried out incubating the samples with excess of the unconjugated anti-cytokine mAbs before the fluorochrome-labeled antibodies were added. Control cultures adding only DMSO were carried out in parallel. Data shown are representative of three (IFN-γ) or two (IL-4) independent experiments. PLZF+ cells were gated with help of isotype-control stainings (not shown).
Figure 4
Figure 4
Rapid in vitro expansion of iNKT cells from F344 inbred rats. (A) Flow cytometry analysis after 7-day culture of splenocytes. Rat- and mouse-derived splenocytes were stained with rat and mouse CD1d dimers, respectively. Mouse B cells, identified as CD19+ cells, were excluded from the analysis. (B) Expanded iNKT cells in 14-day cultures of F344-derived splenocytes stained with rat CD1d dimers and anti-PLZF mAb. (C) Analysis of CD4, CD8β, CD8α, NKR-P1A/B, BV8S4A2, and BV16 expression by PLZF+ and PLZF T cells gated as shown in (B) (PLZF and TCRβ plot). The depicted data are from one of three similar experiments.
Figure 5
Figure 5
Cytokine production by expanded iNKT cells. (A) IL-4 and IFN-γ production by expanded iNKT cells (14-day cultures) studied by flow cytometry. iNKT cells were identified as PLZF+ cells. Control stainings were carried out incubating the samples with excess of the unconjugated anti-cytokine mAbs before the fluorochrome-labeled antibodies were added. Data shown are representative of three independent experiments. (B) Concentrations of IL-4 and INF-γ in the supernatant of F344 cultures with α-GalCer at days 7 and 14 were determined by ELISA. The amounts of IFN-γ and IL-4 contained in culture media supplemented with 10% of Con A supernatant used in 14-day cultures were subtracted from the values obtained in supernatants of expanded cells at day 14. Data are shown as the mean + SD of results pooled from three independent experiments, each performed in duplicate. (C) IL-4 and IFN-γ production by DN, CD4+, and CD8α+ PLZF+ cells. The density plots on the left show the gating strategy. Control stainings of cytokines (filled histograms) were carried out as in (A). The values obtained in four independent experiments are shown, each experiment illustrated with different symbols (right). Means are shown by lines. *p < 0.05 and **p < 0.005, paired t-test.

Similar articles

Cited by

  • Species Specific Differences of CD1d Oligomer Loading In Vitro.
    Paletta D, Fichtner AS, Starick L, Porcelli SA, Savage PB, Herrmann T. Paletta D, et al. PLoS One. 2015 Nov 24;10(11):e0143449. doi: 10.1371/journal.pone.0143449. eCollection 2015. PLoS One. 2015. PMID: 26599805 Free PMC article.
  • Guidelines for the use of flow cytometry and cell sorting in immunological studies (second edition).
    Cossarizza A, Chang HD, Radbruch A, Acs A, Adam D, Adam-Klages S, Agace WW, Aghaeepour N, Akdis M, Allez M, Almeida LN, Alvisi G, Anderson G, Andrä I, Annunziato F, Anselmo A, Bacher P, Baldari CT, Bari S, Barnaba V, Barros-Martins J, Battistini L, Bauer W, Baumgart S, Baumgarth N, Baumjohann D, Baying B, Bebawy M, Becher B, Beisker W, Benes V, Beyaert R, Blanco A, Boardman DA, Bogdan C, Borger JG, Borsellino G, Boulais PE, Bradford JA, Brenner D, Brinkman RR, Brooks AES, Busch DH, Büscher M, Bushnell TP, Calzetti F, Cameron G, Cammarata I, Cao X, Cardell SL, Casola S, Cassatella MA, Cavani A, Celada A, Chatenoud L, Chattopadhyay PK, Chow S, Christakou E, Čičin-Šain L, Clerici M, Colombo FS, Cook L, Cooke A, Cooper AM, Corbett AJ, Cosma A, Cosmi L, Coulie PG, Cumano A, Cvetkovic L, Dang VD, Dang-Heine C, Davey MS, Davies D, De Biasi S, Del Zotto G, Dela Cruz GV, Delacher M, Della Bella S, Dellabona P, Deniz G, Dessing M, Di Santo JP, Diefenbach A, Dieli F, Dolf A, Dörner T, Dress RJ, Dudziak D, Dustin M, Dutertre CA, Ebner F, Eckle SBG, Edinger M, Eede P, Ehrhardt GRA, Eich M, Engel P, Engelhardt B, Erdei A, Esser C, Everts B, Evrard M, Falk CS, Fehniger TA, Felipo-Benavent M, Fer… See abstract for full author list ➔ Cossarizza A, et al. Eur J Immunol. 2019 Oct;49(10):1457-1973. doi: 10.1002/eji.201970107. Eur J Immunol. 2019. PMID: 31633216 Free PMC article.
  • Guidelines for the use of flow cytometry and cell sorting in immunological studies (third edition).
    Cossarizza A, Chang HD, Radbruch A, Abrignani S, Addo R, Akdis M, Andrä I, Andreata F, Annunziato F, Arranz E, Bacher P, Bari S, Barnaba V, Barros-Martins J, Baumjohann D, Beccaria CG, Bernardo D, Boardman DA, Borger J, Böttcher C, Brockmann L, Burns M, Busch DH, Cameron G, Cammarata I, Cassotta A, Chang Y, Chirdo FG, Christakou E, Čičin-Šain L, Cook L, Corbett AJ, Cornelis R, Cosmi L, Davey MS, De Biasi S, De Simone G, Del Zotto G, Delacher M, Di Rosa F, Di Santo J, Diefenbach A, Dong J, Dörner T, Dress RJ, Dutertre CA, Eckle SBG, Eede P, Evrard M, Falk CS, Feuerer M, Fillatreau S, Fiz-Lopez A, Follo M, Foulds GA, Fröbel J, Gagliani N, Galletti G, Gangaev A, Garbi N, Garrote JA, Geginat J, Gherardin NA, Gibellini L, Ginhoux F, Godfrey DI, Gruarin P, Haftmann C, Hansmann L, Harpur CM, Hayday AC, Heine G, Hernández DC, Herrmann M, Hoelsken O, Huang Q, Huber S, Huber JE, Huehn J, Hundemer M, Hwang WYK, Iannacone M, Ivison SM, Jäck HM, Jani PK, Keller B, Kessler N, Ketelaars S, Knop L, Knopf J, Koay HF, Kobow K, Kriegsmann K, Kristyanto H, Krueger A, Kuehne JF, Kunze-Schumacher H, Kvistborg P, Kwok I, Latorre D, Lenz D, Levings MK, Lino AC, Liotta F, Long HM, Lugli E, MacDonald KN, M… See abstract for full author list ➔ Cossarizza A, et al. Eur J Immunol. 2021 Dec;51(12):2708-3145. doi: 10.1002/eji.202170126. Epub 2021 Dec 7. Eur J Immunol. 2021. PMID: 34910301 Free PMC article. Review.
  • Polymorphisms in the CD1d promoter that regulate CD1d gene expression are associated with impaired NKT cell development.
    Borg ZD, Benoit PJ, Lilley GW, Aktan I, Chant A, DeVault VL, Rincon M, Boyson JE. Borg ZD, et al. J Immunol. 2014 Jan 1;192(1):189-99. doi: 10.4049/jimmunol.1301451. Epub 2013 Dec 4. J Immunol. 2014. PMID: 24307737 Free PMC article.
  • The Vγ9Vδ2 T Cell Antigen Receptor and Butyrophilin-3 A1: Models of Interaction, the Possibility of Co-Evolution, and the Case of Dendritic Epidermal T Cells.
    Karunakaran MM, Herrmann T. Karunakaran MM, et al. Front Immunol. 2014 Dec 19;5:648. doi: 10.3389/fimmu.2014.00648. eCollection 2014. Front Immunol. 2014. PMID: 25566259 Free PMC article. Review.

References

    1. Bendelac A, Savage PB, Teyton L. The biology of NKT cells. Annu Rev Immunol. 2007;25:297–336. - PubMed
    1. Looringh van Beeck FA, Reinink P, Hermsen R, Zajonc DM, Laven MJ, Fun A, Troskie M, et al. Functional CD1d and/or NKT cell invariant chain transcript in horse, pig, African elephant and guinea pig, but not in ruminants. Mol Immunol. 2009;46:1424–1431. - PMC - PubMed
    1. Koseki H, Imai K, Nakayama F, Sado T, Moriwaki K, Taniguchi M. Homogenous junctional sequence of the V14+ T-cell antigen receptor alpha chain expanded in unprimed mice. Proc Natl Acad Sci U S A. 1990;87:5248–5252. - PMC - PubMed
    1. Lantz O, Bendelac A. An invariant T cell receptor alpha chain is used by a unique subset of major histocompatibility complex class I-specific CD4+ and CD4-8- T cells in mice and humans. J Exp Med. 1994;180:1097–1106. - PMC - PubMed
    1. Godfrey DI, MacDonald HR, Kronenberg M, Smyth MJ, Van Kaer L. NKT cells: what's in a name? Nat Rev Immunol. 2004;4:231–237. - PubMed

Publication types

LinkOut - more resources