

Comparison of R2* correction methods for accurate fat quantification in fatty liver
- PMID: 23165934
- PMCID: PMC3557786
- DOI: 10.1002/jmri.23835
Comparison of R2* correction methods for accurate fat quantification in fatty liver
Abstract
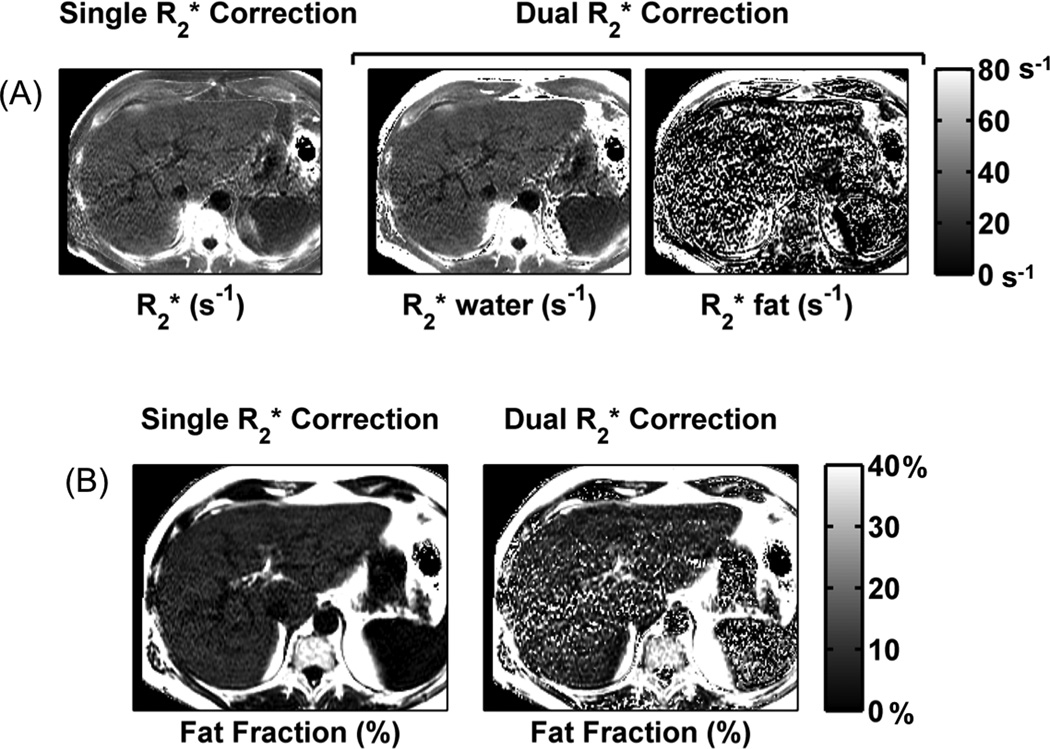
Purpose: To compare the performance of fat fraction quantification using single-R(2)* and dual-R(2)* correction methods in patients with fatty liver, using MR spectroscopy (MRS) as the reference standard.
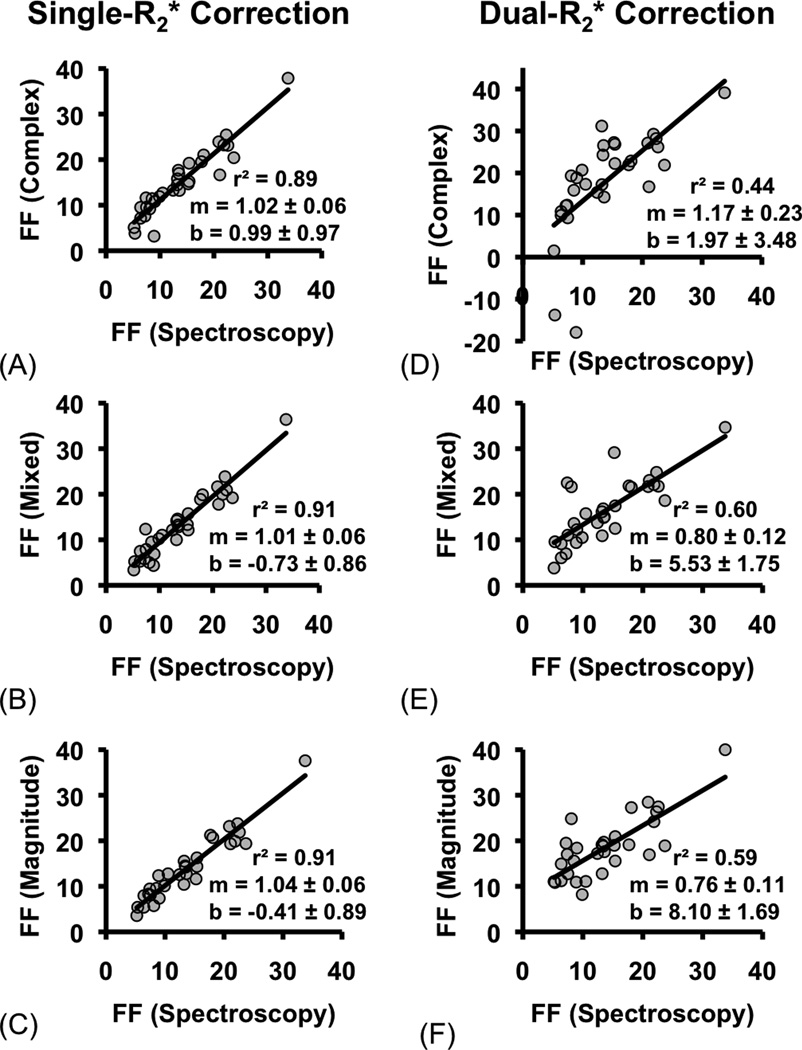
Materials and methods: From a group of 97 patients, 32 patients with hepatic fat fraction greater than 5%, as measured by MRS, were identified. In these patients, chemical shift encoded fat-water imaging was performed, covering the entire liver in a single breathhold. Fat fraction was measured from the imaging data by postprocessing using 6 different models: single- and dual-R(2)* correction, each performed with complex fitting, magnitude fitting, and mixed magnitude/complex fitting to compare the effects of phase error correction. Fat fraction measurements were compared with co-registered spectroscopy measurements using linear regression.
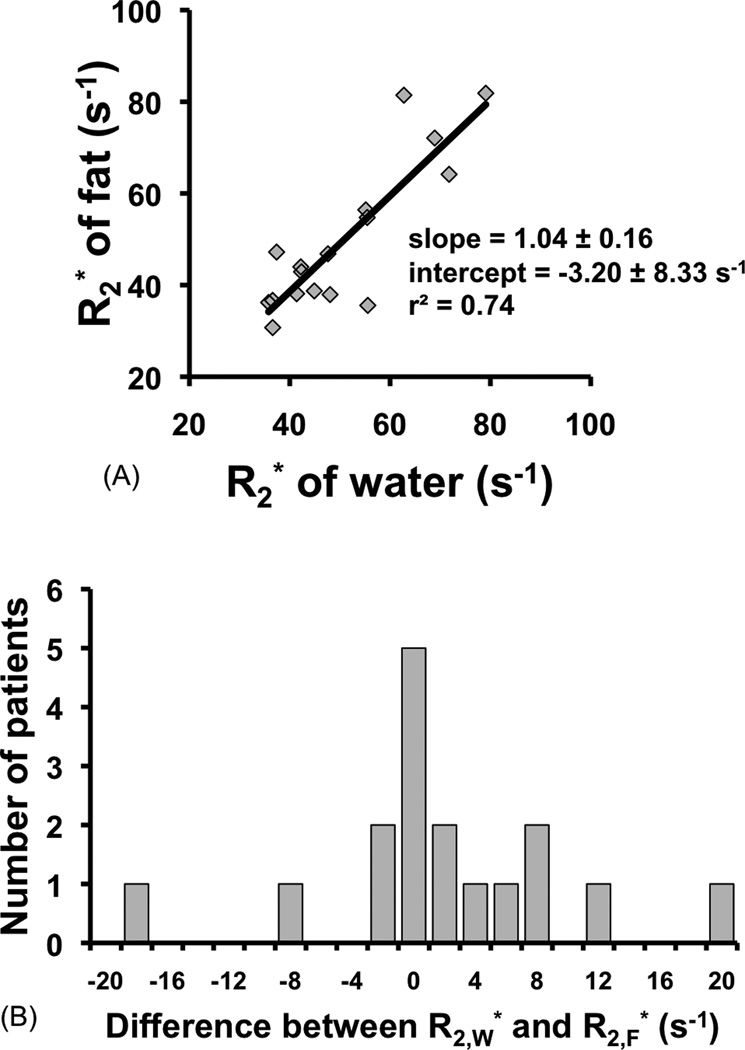
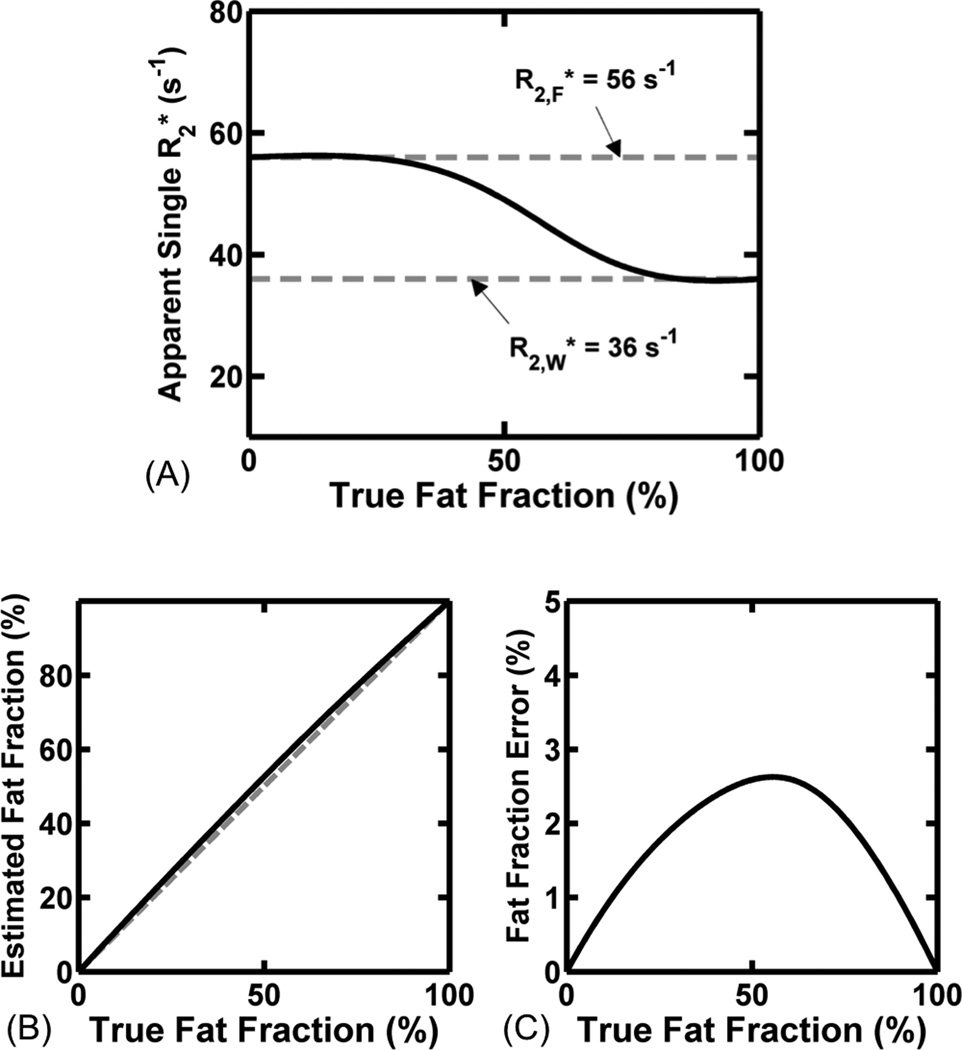
Results: Linear regression demonstrated higher agreement with MRS using single-R(2)* correction compared with dual-R(2)* correction. Among single-R(2)* models, all 3 fittings methods performed similarly well (slope = 1.0 ± 0.06, r(2) = 0.89-0.91).
Conclusion: Single-R(2)* modeling is more accurate than dual-R(2)* modeling for hepatic fat quantification in patients, even in those with high hepatic fat concentrations.
Copyright © 2012 Wiley Periodicals, Inc.
Figures
Similar articles
-
Quantification of liver fat in the presence of iron overload.J Magn Reson Imaging. 2017 Feb;45(2):428-439. doi: 10.1002/jmri.25382. Epub 2016 Jul 13. J Magn Reson Imaging. 2017. PMID: 27405703 Free PMC article.
-
T1 bias in chemical shift-encoded liver fat-fraction: role of the flip angle.J Magn Reson Imaging. 2014 Oct;40(4):875-83. doi: 10.1002/jmri.24457. Epub 2013 Nov 15. J Magn Reson Imaging. 2014. PMID: 24243439 Free PMC article. Clinical Trial.
-
Quantitative MRI for hepatic fat fraction and T2* measurement in pediatric patients with non-alcoholic fatty liver disease.Pediatr Radiol. 2014 Nov;44(11):1379-87. doi: 10.1007/s00247-014-3024-y. Epub 2014 May 20. Pediatr Radiol. 2014. PMID: 24840769
-
Quantification of hepatic steatosis with T1-independent, T2-corrected MR imaging with spectral modeling of fat: blinded comparison with MR spectroscopy.Radiology. 2011 Mar;258(3):767-75. doi: 10.1148/radiol.10100708. Epub 2011 Jan 19. Radiology. 2011. PMID: 21248233 Free PMC article.
-
Quantification of liver fat with magnetic resonance imaging.Magn Reson Imaging Clin N Am. 2010 Aug;18(3):337-57, ix. doi: 10.1016/j.mric.2010.08.013. Magn Reson Imaging Clin N Am. 2010. PMID: 21094444 Free PMC article. Review.
Cited by
-
Quantitative proton MR techniques for measuring fat.NMR Biomed. 2013 Dec;26(12):1609-29. doi: 10.1002/nbm.3025. Epub 2013 Oct 3. NMR Biomed. 2013. PMID: 24123229 Free PMC article. Review.
-
Cross-sectional correlation between hepatic R2* and proton density fat fraction (PDFF) in children with hepatic steatosis.J Magn Reson Imaging. 2018 Feb;47(2):418-424. doi: 10.1002/jmri.25748. Epub 2017 May 25. J Magn Reson Imaging. 2018. PMID: 28543915 Free PMC article.
-
Quantification of liver proton-density fat fraction in 7.1T preclinical MR systems: Impact of the fitting technique.J Magn Reson Imaging. 2016 Dec;44(6):1425-1431. doi: 10.1002/jmri.25319. Epub 2016 May 19. J Magn Reson Imaging. 2016. PMID: 27197806 Free PMC article.
-
Simultaneous Quantification of Bone Edema/Adiposity and Structure in Inflamed Bone Using Chemical Shift-Encoded MRI in Spondyloarthritis.Magn Reson Med. 2018 Feb;79(2):1031-1042. doi: 10.1002/mrm.26729. Epub 2017 Jun 6. Magn Reson Med. 2018. PMID: 28589660 Free PMC article.
-
Proximal femur fat fraction variation in healthy subjects using chemical shift-encoding based MRI.Sci Rep. 2019 Dec 27;9(1):20212. doi: 10.1038/s41598-019-56611-8. Sci Rep. 2019. PMID: 31882855 Free PMC article.
References
-
- Flegal KM, Carroll MD, Ogden CL, Curtin LR. Prevalence and trends in obesity among US adults, 1999–2008. JAMA. 2010;303(3):235–241. - PubMed
-
- Szczepaniak LS, Nurenberg P, Leonard D, et al. Magnetic resonance spectroscopy to measure hepatic triglyceride content: prevalence of hepatic steatosis in the general population. Am J Physiol Endocrinol Metab. 2005;288(2):E462–E468. - PubMed
-
- Hashimoto E, Tokushige K. Prevalence, gender, ethnic variations, and prognosis of NASH. J Gastroenterol. 2011;46(Suppl 1):63–69. - PubMed
-
- Reeder S, Hines C, Yu H, McKenzie C, Brittain J. On The Definition of Fat-Fraction for In Vivo Fat Quantification with Magnetic Resonance Imaging; In Proceedings of the 17th Scientific Meeting, International Society for Magnetic Resonance in Medicine; April; Honolulu: 2009. p. 211.
Publication types
MeSH terms
Grants and funding
LinkOut - more resources
Full Text Sources
Other Literature Sources
Medical
