. 2013 Jan 4;288(1):608-18.
doi: 10.1074/jbc.M112.425736. Epub 2012 Nov 19.

Oncogenic microRNA-155 down-regulates tumor suppressor CDC73 and promotes oral squamous cell carcinoma cell proliferation: implications for cancer therapeutics

Affiliations

Oncogenic microRNA-155 down-regulates tumor suppressor CDC73 and promotes oral squamous cell carcinoma cell proliferation: implications for cancer therapeutics

Mohammad Iqbal Rather et al. J Biol Chem. .

Abstract

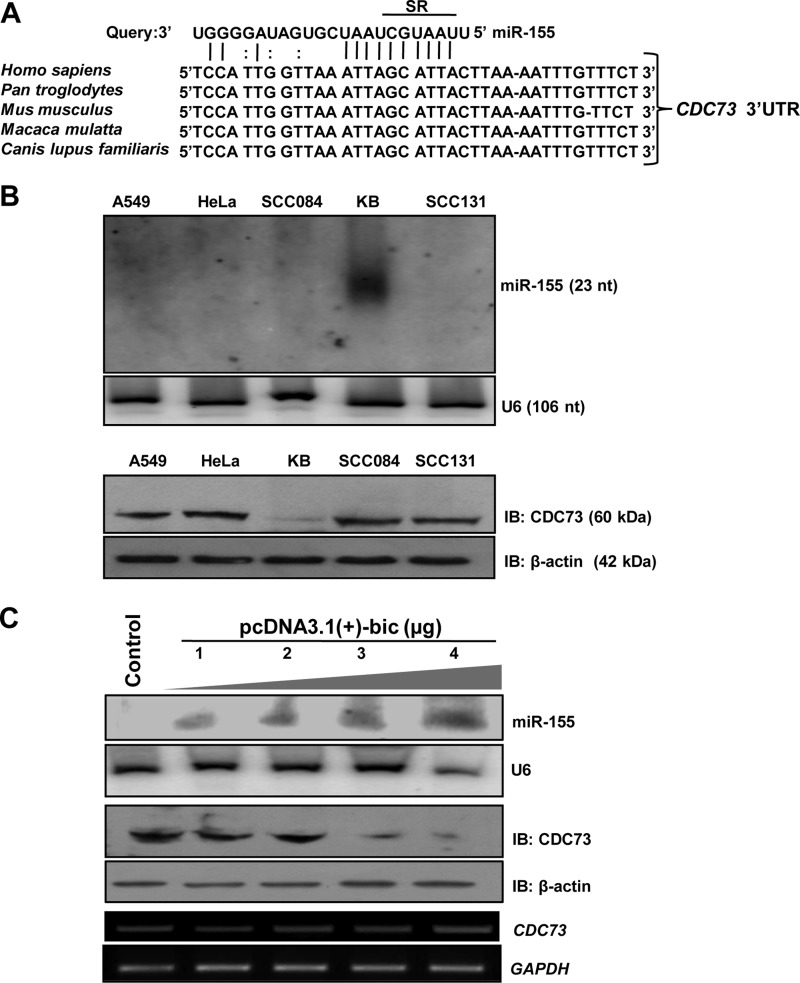
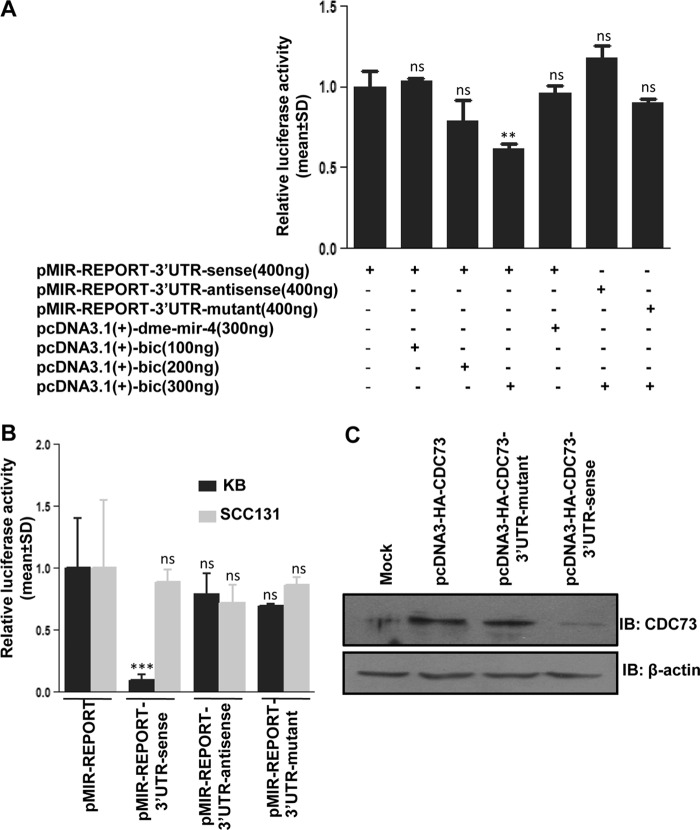
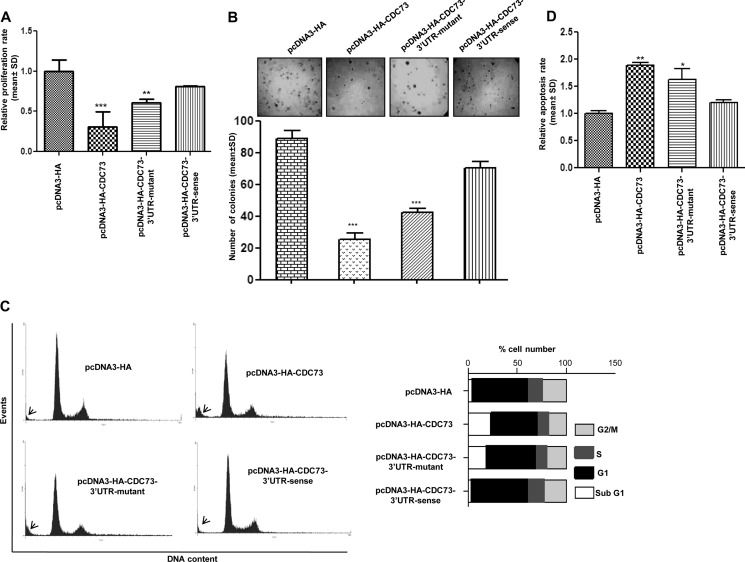
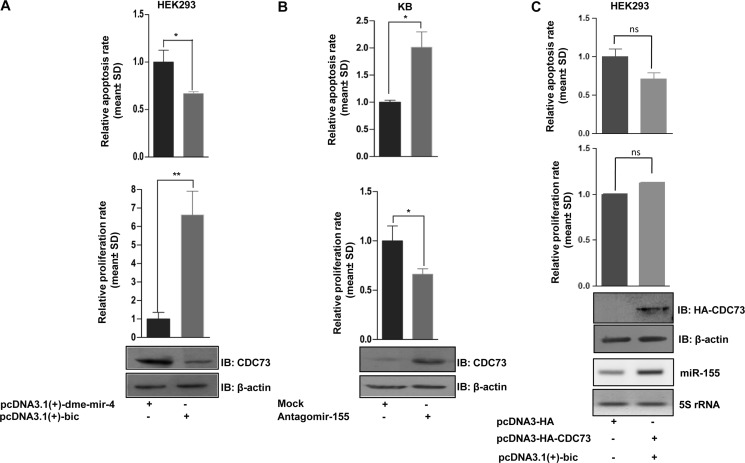
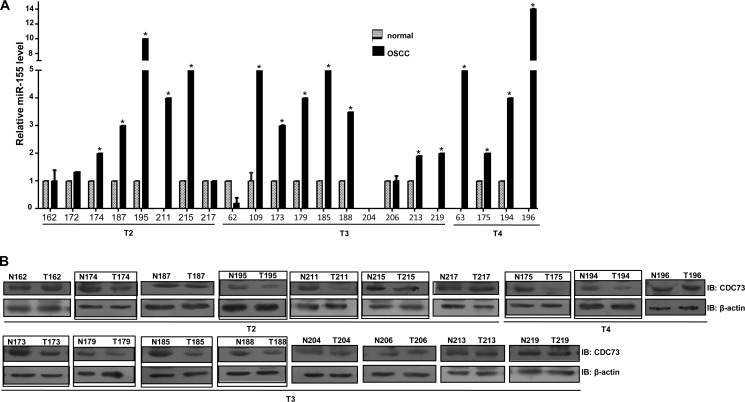
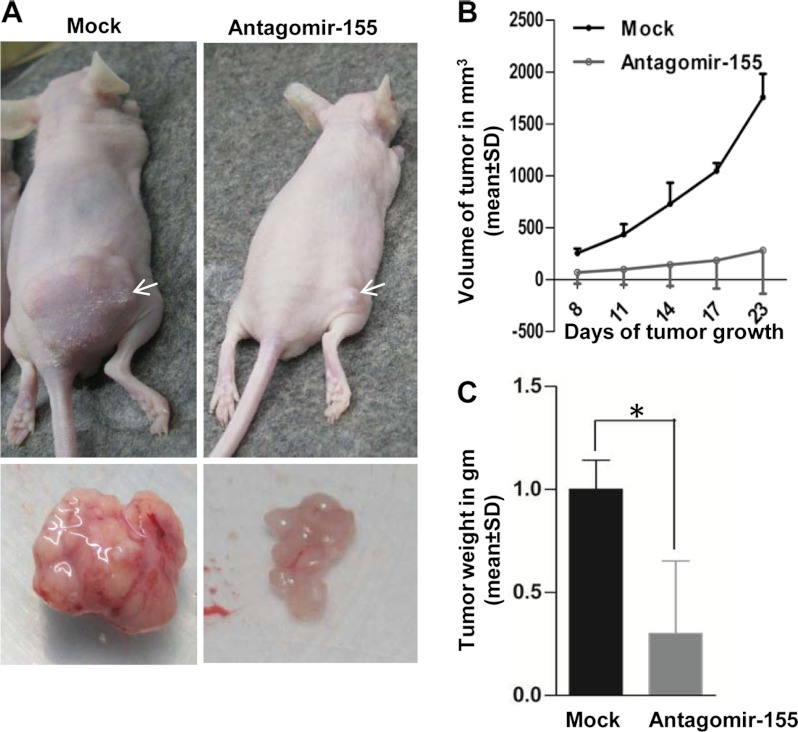
The CDC73 gene is mutationally inactivated in hereditary and sporadic parathyroid tumors. It negatively regulates β-catenin, cyclin D1, and c-MYC. Down-regulation of CDC73 has been reported in breast, renal, and gastric carcinomas. However, the reports regarding the role of CDC73 in oral squamous cell carcinoma (OSCC) are lacking. In this study we show that CDC73 is down-regulated in a majority of OSCC samples. We further show that oncogenic microRNA-155 (miR-155) negatively regulates CDC73 expression. Our experiments show that the dramatic up-regulation of miR-155 is an exclusive mechanism for down-regulation of CDC73 in a panel of human cell lines and a subset of OSCC patient samples in the absence of loss of heterozygosity, mutations, and promoter methylation. Ectopic expression of miR-155 in HEK293 cells dramatically reduced CDC73 levels, enhanced cell viability, and decreased apoptosis. Conversely, the delivery of a miR-155 antagonist (antagomir-155) to KB cells overexpressing miR-155 resulted in increased CDC73 levels, decreased cell viability, increased apoptosis, and marked regression of xenografts in nude mice. Cotransfection of miR-155 with CDC73 in HEK293 cells abrogated its pro-oncogenic effect. Reduced cell proliferation and increased apoptosis of KB cells were dependent on the presence or absence of the 3'-UTR in CDC73. In summary, knockdown of CDC73 expression due to overexpression of miR-155 not only adds a novelty to the list of mechanisms responsible for its down-regulation in different tumors, but the restoration of CDC73 levels by the use of antagomir-155 may also have an important role in therapeutic intervention of cancers, including OSCC.


Figures

FIGURE 1.
FIGURE 1.
Identification of miR-155 as a regulator of CDC73 expression. A, shown is a putative miR-155 binding site within the CDC73 3′-UTR (GenBankTM accession no. NM_024529.0). Perfect matches and G:U (or G:T) pairs are indicated by vertical lines and colons, respectively. The ClustalW alignment shows that the putative miR-155 binding site is conserved in different species. SR (seed region) denotes the seed region. B, shown is expression analysis of miR-155 and CDC73 in A549, HeLa, SCC084, KB, and SCC131 cells. Note the expression of miR-155 only in KB cells (upper panel). Also note the reduced expression of CDC73 in KB cells as compared with other cell lines (lower panel), suggesting that miR-155 negatively regulates CDC73. The expression of miR-155 and CDC73 was analyzed by Northern and Western hybridizations, respectively. C, shown is the effect of miR-155 overexpression on CDC73 expression in HEK293T cells. For overexpression of miR-155, 1–4 μg of pcDNA3.1(+)-bic was transfected in HEK293T cells. The Control lane represents transfection of HEK293T cells with the D. melanogaster miRNA dme-mir-4-expressing construct pcDNA3.1(+)-dme-mir-4 that does not have any mammalian target as shown by prediction programs used in this study. Note the overexpression of miR-155 led to reduced CDC73 expression in a dose-dependent manner. U6 RNA, GAPDH, and β-actin were used as loading controls for Northern, RT-PCR, and Western hybridization, respectively. IB, immunoblot; nt, nucleotides.
FIGURE 2.
FIGURE 2.
Confirmation of the miR-155 target site in the CDC73 3′-UTR. A, miR-155 reduces luciferase expression in HEK293T cells by binding to a target site in the CDC73 3′-UTR. Note that an increasing concentration of pcDNA3.1(+)-bic significantly reduces the luciferase expression in cells co-transfected with pMIR-REPORT-3′-UTR-sense construct compared with cells transfected with pMIR-REPORT-3′-UTR-sense alone, whereas the luciferase expression does not change in cells co-transfected with pcDNA3.1(+)-bic and pMIR-REPORT-3′-UTR-antisense or pMIR-REPORT-3′-UTR-mutant constructs compared with cells transfected with p-MIR-REPORT-3′-UTR-sense construct alone. Also note that the luciferase expression does not change in cells co-transfected with pMIR-REPORT-3′-UTR-sense and pcDNA3.1(+)-dme-mir-4 constructs compared with cells transfected with p-MIR-REPORT-3′-UTR-sense construct alone, suggesting that miR-155 reduces the luciferase expression by binding to a specific site in the CDC73 3′-UTR. The total DNA for each transfection was adjusted to 800 ng with the pcDNA3.1(+) vector. B, the effect of endogenous miR-155 on luciferase reporter expression is shown. The luciferase reporter vector pMIR-REPORT (control) and luciferase reporter constructs with CDC73 3′-UTR, pMIR-REPORT-3′-UTR-sense, pMIR-REPORT-3′-UTR-mutant, and pMIR-REPORT-3′-UTR-antisense were transfected individually in KB and SCC131 cells, and the luciferase expression was measured post-24 h of transfection. Note a reduced expression of luciferase reporter in KB cells with pMIR-REPORT-3′-UTR-sense construct as compared with cells transfected with the pMIR-REPORT vector, pMIR-REPORT-3′-UTR-mutant, or pMIR-REPORT-3′-UTR-antisense constructs. This is due to the fact that a high endogenous level of miR-155 is able to bind the CDC73 3′-UTR in a sense orientation and inhibit translation of the luciferase reporter. Also note that the luciferase expression does not change in SCC131 cells with an undetectable level of miR-155 when these cells were transfected with the pMIR-REPORT vector, pMIR-REPORT-3′-UTR-sense, pMIR-REPORT-3′-UTR-mutant, or pMIR-REPORT-3′-UTR-antisense constructs. C, shown is the effect of an endogenous level of miR-155 on the expression of CDC73 with or without its 3′-UTR in KB cells. Note a reduced expression of CDC73 in cells transfected with the construct pcDNA3-HA-CDC73–3′-UTR-sense having its 3′-UTR in a sense orientation as compared with cells transfected with the construct pcDNA3-HA-CDC73 without its 3′-UTR or the construct pcDNA3-HA-CDC73–3′-UTR-mutant with its mutated miR-155 binding site, underscoring that miR-155 targets CDC73 by binding to its 3′-UTR. Mock represents cells transfected with the pcDNA3-HA vector. n = 3; ns, data are statistically non-significant; **, p < 0.01; ***, p < 0.001. IB, immunoblot.
FIGURE 3.
FIGURE 3.
Anti-tumorigenic function of CDC73 in KB cells. A, shown is a quantitative analysis of cell proliferation by the MTT assay. Note a significantly reduced proliferation of KB cells transfected with either pcDNA3-HA-CDC73 or pcDNA3-HA-CDC73–3′-UTR-mutant constructs compared with cells transfected with either pcDNA3-HA (vector control) or pcDNA3-HA-CDC73–3′-UTR-sense construct. B, shown is an assessment of tumorigenic potential of KB cells by the soft agar assay. Note a reduction in the number of colony formation by KB cells transfected with either pcDNA3-HA-CDC73 or pcDNA3-HA-CDC73–3′-UTR-mutant constructs compared with cells transfected with either pcDNA3-HA or pcDNA3-HA-3′-UTR-CDC73-sense construct. The lower panel is a graphical representation of the soft agar data. C, shown is a FACS analysis of propidium iodide-stained KB cells stably transfected with the pcDNA3-HA vector and different CDC73 constructs. The sub-G1 population (cells undergoing death) is marked by arrows. Note an increase in sub-G1 population of cells transfected with either pcDNA3-HA-CDC73 or pcDNA3-HA-CDC73–3′-UTR-mutant constructs compared with cells transfected with either pcDNA3-HA or pcDNA3-HA-CDC73–3′-UTR-sense. A graphical representation of the data is shown on the right. D, shown is the assessment of the rate of apoptosis by the CASP3 assay. Note a significantly increased rate of apoptosis in KB cells transfected with either pcDNA3-HA-CDC73 or pcDNA3-HA-CDC73–3′-UTR-mutant constructs compared with cells transfected with either pcDNA3-HA or pcDNA3-HA-CDC73–3′-UTR-sense. n = 3; *, p < 0.05; **, p < 0.01; ***, p < 0.001.
FIGURE 4.
FIGURE 4.
Regulation of cell proliferation and apoptosis by CDC73 as a target of miR-155. A, overexpression of miR-155 (pcDNA3.1(+)-bic) leads to a significantly reduced CDC73 expression, resulting in increased cell growth and proliferation and decreased apoptosis in HEK293 cells compared with cells transfected with a non-relevant Drosophila miRNA pcDNA3.1(+)-dme-mir-4 construct. IB, immunoblot. B, knockdown of miR-155 by antagomir-155 led to an increased CDC73 expression, resulting in reduced cell growth and proliferation and increased apoptosis in KB cells compared with cells transfected with a non-relevant scrambled oligo (mock). C, CDC73 overexpression abrogated the effect of miR-155 overexpression on proliferation and apoptosis in HEK293 cells. n = 3; ns, data are statistically non-significant; *, p < 0.05; **, p < 0.01.
FIGURE 5.
FIGURE 5.
Up-regulation of miR-155 in OSCC samples with reduced expression of CDC73. A, mir-Q RT-PCR was performed to assess the level of miR-155 in matched OSCC and normal oral tissues (n = 22). Note a significant up-regulation of miR-155 levels in 16/22 OSCC samples compared with their matching normal samples (p < 0.05). No miR-155 expression was detected in normal samples from patients #211, 219, 63, and 196. The relative expression of miR-155 in tumor samples from these patients was calculated relative to the average expression of miR-155 in the rest of the normal samples. Both normal and tumor tissues of patient #204 did not show miR-155 expression upon analysis by mir-Q RT-PCR. B, shown is Western blot (IB) analysis to assess the expression of CDC73 in 18 matched OSSC and normal oral tissue samples. Note the down-regulation of CDC73 in 10 samples (marked by a rectangle) in comparison to their matching normal counterparts; this down-regulation occurs even in the early stages of OSCC development (see tumor samples from patient #174, 195, 211, and 215). Also note that all the 10 OSCC samples showing reduced CDC73 expression have a significant up-regulation of miR-155. The numbers represent different patients. T2, T3, and T4 denote stages of the tumors.
FIGURE 6.
FIGURE 6.
miR-155 inhibition suppresses tumorigenicity in vivo in BALB/c nude mice. A, shown is the effect ofantagomir-155 pretreatment to KB cells on tumor formation in a nude mouse xenograft model. Scrambled oligo-transfected (mock, left panel) and antagomir-155-transfected KB cells (right panel) were subcutaneously injected into posterior right flanks of nude mice (n = 6). Photographs illustrate representative features of tumor growth on day 23 after injection. Arrows mark the xenografts. Excised xenografts are shown below. B, shown is the effect of the antagomir-155 on tumor volume as compared with mock-treated KB cells during a time course of 23 days. C, shown is the effect of the antagomir-155 on tumor weight as compared with mock-treated KB cells. The graph illustrates the weight difference on day 23 after injection. Note that the pretreatment of KB cells with antagomir-155 significantly reduces the tumor volume and weight in nude mice xenografts. *, p < 0.05.

Similar articles

Cited by

References

    1. Shattuck T. M., Välimäki S., Obara T., Gaz R. D., Clark O.H., Shoback D., Wierman M. E., Tojo K., Robbins C. M., Carpten J. D., Farnebo L. O., Larsson C., Arnold A. (2003) Somatic and germ line mutations of the HRPT2 gene in sporadic parathyroid carcinoma. N. Engl. J. Med. 349, 1722–1729 - PubMed
    1. Aldred M. J., Talacko A. A., Savarirayan R., Murdolo V., Mills A. E., Radden B. G., Alimov A., Villablanca A., Larsson C. (2006) Dental findings in a family with hyperparathyroidism. Jaw tumour syndrome and a novel HRPT2 gene mutation. Oral Surg. Oral Med. Oral Pathol. Oral Radiol. Endod. 101, 212–218 - PubMed
    1. Pimenta F. J., Gontijo Silveira L.F., Tavares G. C., Silva A. C., Perdigão P. F., Castro W. H., Gomez M. V., Teh B. T., De Marco L., Gomez R. S. (2006) HRPT2 gene alterations in ossifying fibroma of the jaws. Oral. Oncol. 42, 735–739 - PubMed
    1. Carpten J. D., Robbins C. M., Villablanca A., Forsberg L., Presciuttini S., Bailey-Wilson J., Simonds W. F., Gillanders E. M., Kennedy A. M., Chen J. D., Agarwal S. K., Sood R., Jones M. P., Moses T. Y., Haven C., Petillo D., Leotlela P. D., Harding B., Cameron D., Pannett A. A., Höög A., Heath H., 3rd, James-Newton L. A., Robinson B., Zarbo R. J., Cavaco B. M., Wassif W., Perrier N. D., Rosen I. B., Kristoffersson U., Turnpenny P. D., Farnebo L. O., Besser G. M., Jackson C. E., Morreau H., Trent J. M., Thakker R. V., Marx S. J., Teh B. T., Larsson C., Hobbs M. R. (2002) HRPT2, encoding parafibromin, is mutated in hyperparathyroidism. Jaw tumour syndrome. Nat. Genet. 32, 676–680 - PubMed
    1. Bradley K. J., Cavaco B. M., Bowl M. R., Harding B., Young A., Thakker R. V. (2005) Utilisation of a cryptic non-canonical donor splice site of the gene encoding PARAFIBROMIN is associated with familial isolated primary hyperparathyroidism. J. Med. Genet. 42, e51. - PMC - PubMed

Publication types