. 2013 Feb 1;288(5):2986-93.
doi: 10.1074/jbc.M112.386573. Epub 2012 Nov 19.

Cytokine response is determined by duration of receptor and signal transducers and activators of transcription 3 (STAT3) activation

Affiliations

Cytokine response is determined by duration of receptor and signal transducers and activators of transcription 3 (STAT3) activation

David A Braun et al. J Biol Chem. .

Abstract

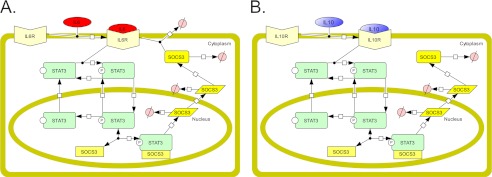
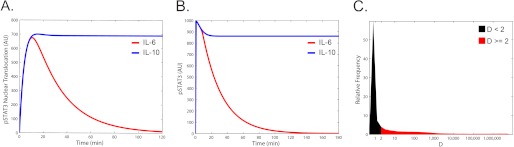
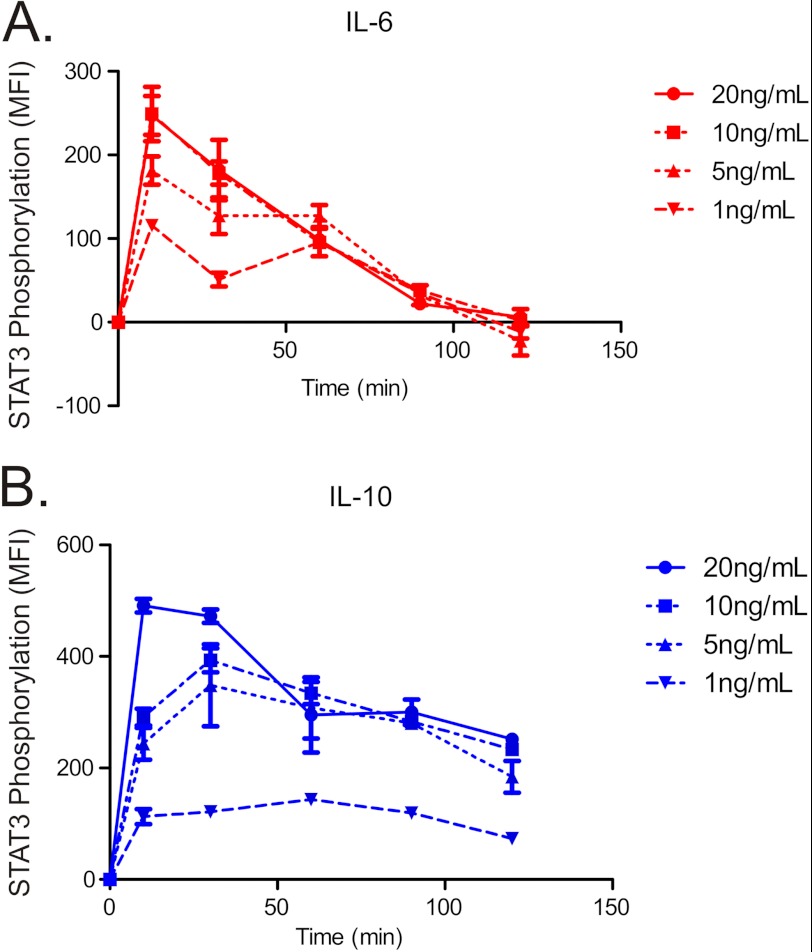
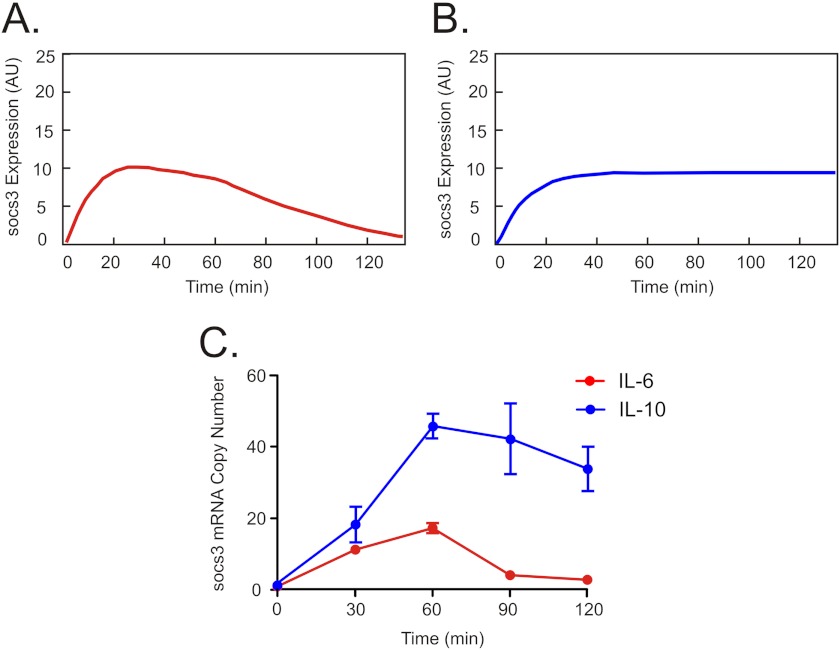
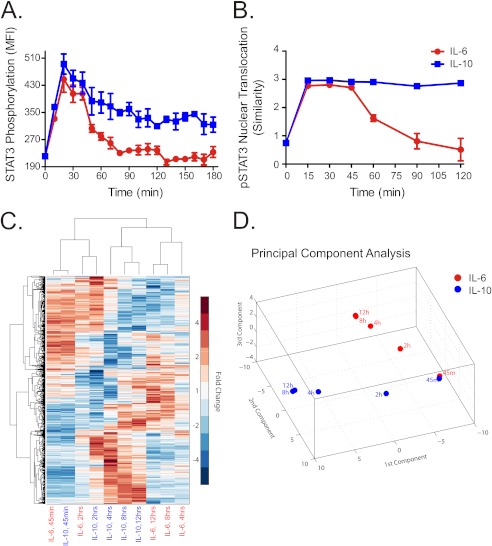
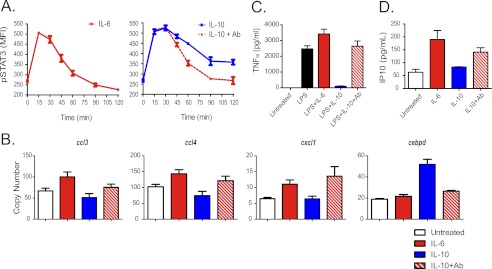
Paradoxically, the pro-inflammatory cytokine IL-6 and the anti-inflammatory cytokine IL-10 both activate STAT3, yet generate nearly opposing cellular responses. Here, we show that the temporal pattern of STAT3 activation codes for the specific cytokine response. A computational model of IL-6 and IL-10 signaling predicted that IL-6 stimulation results in transient activation of STAT3, with a rapid decline in phosphorylation and nuclear localization. In contrast, simulated IL-10 signaling resulted in sustained STAT3 activation. The predicted STAT3 patterns produced by each cytokine were confirmed experimentally in human dendritic cells. Time course microarray studies further showed that the dynamic genome-wide transcriptional responses were nearly identical at early time points following stimulation (when STAT3 is active in response to both IL-6 and IL-10) but divergent at later times (when STAT3 is active only in response to IL-10). Truncating STAT3 activation after IL-10 stimulation caused IL-10 to elicit an IL-6-like transcriptional and secretory response. That the duration of IL-10 receptor and STAT3 activation can direct distinct responses reveals a complex cellular information-coding mechanism that may be relevant to improving the prediction of the effects of drug candidates using this mechanism.


Figures

FIGURE 1.
FIGURE 1.
Schematic representations of IL-6 and IL-10 signaling models. A and B, schematics of molecular species and reactions included in the IL-6 model (A) and the IL-10 model (B). Reactions are depicted by black arrow lines, with the beginning of the arrow representing the reactants and the end of the arrow representing the products. The SOCS3 rectangle species in the nucleus represents socs3 DNA, the SOCS3 parallelogram species represents SOCS3 mRNA, and the SOCS3 rounded rectangle species represents SOCS3 protein. The degradation reactions are depicted by arrows ending in Ø.
FIGURE 2.
FIGURE 2.
Simulation results of the IL-6 and IL-10 signaling models. A and B, simulated time course of the level of nuclear phosphorylated STAT3 (A) and total phosphorylated STAT3 (B) following IL-6 (red) or IL-10 (blue) stimulation. AU is arbitrary units. C, distribution of D values for ∼100,000 simulations with randomly chosen parameters, where D reflects the difference in STAT3 activity produced by each cytokine (see “Experimental Procedures”). All parameters were simultaneously, randomly selected from a 6 orders of magnitude range, simulations of IL-6 and IL-10 signaling were performed, and the D value was calculated. The distribution of D values from ∼100,000 simulations is shown. Simulations with D values that represent prolonged IL-10 versus IL-6 STAT3 duration (D ≥ 2) are shown in red, and simulations that were below this relative duration threshold are shown in black.
FIGURE 3.
FIGURE 3.
Phosphorylation and of STAT3 in response to IL-6 or IL-10. A and B, time course of STAT3 tyrosine 705 phosphorylation in IL-6–treated (A) and IL-10–treated (B) DCs, measured by flow cytometry in response to cytokine concentrations of 1, 5, 10, and 20 ng/ml. MFI is median fluorescence intensity. Error bars are S.D. of MFI of three samples from the same blood donor.
FIGURE 4.
FIGURE 4.
Expression of socs3 gene in response to IL-6 and IL-10. A and B, simulated time course of the level of socs3 gene induction in response to IL-6 (A) and IL-10 (B). AU is arbitrary units. C, time course of socs3 gene expression in IL-6–treated (red) and IL-10–treated (blue) DCs, measured by RT-PCR. Error bars are S.E. of three independent samples from the same blood donor.
FIGURE 5.
FIGURE 5.
Nuclear translocation of STAT3 and dynamic genome-wide transcriptional responses to IL-6 and IL-10. A, time course of STAT3 tyrosine 705 phosphorylation in IL-6–treated (red) and IL-10–treated (blue) DCs, measured by flow cytometry. MFI is median fluorescence intensity. Error bars are S.D. of MFI of three samples from the same blood donor. B, time course of the nuclear translocation of phosphorylated STAT3 (pSTAT3) in response to IL-6 (red) or IL-10 (blue). For each cell, the pixel-by-pixel correlation, ρ, between the pSTAT3 and nuclear fluorescence intensity images was determined, and similarity was calculated (see “Experimental Procedures”). The median similarity ± S.D. (error bars) of all cells in three samples are shown. C, hierarchical clustering by sample treatment/duration and by genes was performed using the median -fold change in expression relative to untreated cells. Rows represent differentially expressed genes, and columns represent different sample treatments and durations. D, principal component analysis of differentially expressed genes in response to IL-6 (red) or IL-10 (blue) stimulation. The three components plotted account for ∼90% of the total variance.
FIGURE 6.
FIGURE 6.
Truncation of IL-10–induced STAT3 activation leads to IL-6–like response. A, DCs were treated with IL-6 (red, left panel), IL-10 (blue, right panel), or IL-10 with anti-IL10Rα receptor-blocking antibodies added 30 min afterward (red dotted, right panel), and STAT3 phosphorylation (pSTAT3) was measured by flow cytometry. MFI is median fluorescence intensity. Error bars are S.D. of MFI of three samples from the same blood donor. B, truncation of IL-10–induced STAT3 activation leads to an IL-6–like transcriptional response. DCs were left untreated (white), or treated with IL-6 (red), IL-10 (blue), or IL-10 with anti-IL10Rα receptor-blocking antibodies added 30 min afterward (red and white), and the expression of four target genes was measured after 4 h by RT-PCR. Error bars are S.E. of six samples from the same blood donor. C, truncation of IL-10–induced STAT3 activation leads to loss of IL-10 anti-inflammatory activity. DCs were left untreated or were treated with LPS (black), LPS and IL-6 (red), LPS and IL-10 (blue), or LPS and IL-10 with anti-IL10Rα receptor-blocking antibodies added 30 min afterward (red and white), and secretion of TNFα into the media after 6 h was measured by ELISA. Error bars are S.E. of three samples from the same blood donor. D, truncation of IL-10–induced STAT3 activation leads to gain of IL-6 pro-inflammatory activity. DCs were left untreated or treated IL-6 (red), IL-10 (blue), or IL-10 with anti-IL10Rα receptor-blocking antibodies added 30 min afterward (red and white), and secretion of the inflammatory chemokine IP-10 into the media after 6 h was measured by Luminex essay. Error bars are S.E. of three samples from the same blood donor.

References

    1. Ishihara K., Hirano T. (2002) IL-6 in autoimmune disease and chronic inflammatory proliferative disease. Cytokine Growth Factor Rev. 13, 357–368 - PubMed
    1. Lio D., Licastro F., Scola L., Chiappelli M., Grimaldi L. M., Crivello A., Colonna-Romano G., Candore G., Franceschi C., Caruso C. (2003) Interleukin-10 promoter polymorphism in sporadic Alzheimer's disease. Genes Immun. 4, 234–238 - PubMed
    1. Nishimoto N., Kishimoto T. (2004) Inhibition of IL-6 for the treatment of inflammatory diseases. Curr. Opin. Pharmacol. 4, 386–391 - PubMed
    1. Tagore A., Gonsalkorale W. M., Pravica V., Hajeer A. H., McMahon R., Whorwell P. J., Sinnott P. J., Hutchinson I. V. (1999) Interleukin-10 (IL-10) genotypes in inflammatory bowel disease. Tissue Antigens 54, 386–390 - PubMed
    1. Darnell J. E. (2005) Validating Stat3 in cancer therapy. Nat. Med. 11, 595–596 - PubMed

Publication types

MeSH terms