

A Bayesian inference framework to reconstruct transmission trees using epidemiological and genetic data
- PMID: 23166481
- PMCID: PMC3499255
- DOI: 10.1371/journal.pcbi.1002768
A Bayesian inference framework to reconstruct transmission trees using epidemiological and genetic data
Abstract
The accurate identification of the route of transmission taken by an infectious agent through a host population is critical to understanding its epidemiology and informing measures for its control. However, reconstruction of transmission routes during an epidemic is often an underdetermined problem: data about the location and timings of infections can be incomplete, inaccurate, and compatible with a large number of different transmission scenarios. For fast-evolving pathogens like RNA viruses, inference can be strengthened by using genetic data, nowadays easily and affordably generated. However, significant statistical challenges remain to be overcome in the full integration of these different data types if transmission trees are to be reliably estimated. We present here a framework leading to a bayesian inference scheme that combines genetic and epidemiological data, able to reconstruct most likely transmission patterns and infection dates. After testing our approach with simulated data, we apply the method to two UK epidemics of Foot-and-Mouth Disease Virus (FMDV): the 2007 outbreak, and a subset of the large 2001 epidemic. In the first case, we are able to confirm the role of a specific premise as the link between the two phases of the epidemics, while transmissions more densely clustered in space and time remain harder to resolve. When we consider data collected from the 2001 epidemic during a time of national emergency, our inference scheme robustly infers transmission chains, and uncovers the presence of undetected premises, thus providing a useful tool for epidemiological studies in real time. The generation of genetic data is becoming routine in epidemiological investigations, but the development of analytical tools maximizing the value of these data remains a priority. Our method, while applied here in the context of FMDV, is general and with slight modification can be used in any situation where both spatiotemporal and genetic data are available.
Conflict of interest statement
The authors have declared that no competing interests exist.
Figures
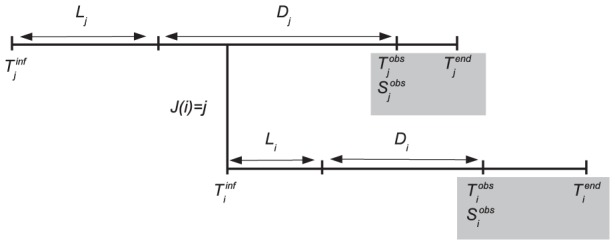
 is infected at time
  , becomes infectious after a latent period
  , is observed at time
  , when a viral sequence
  is obtained, and is removed from susceptible population (i.e. loses its ability to infect other premises) at time
  . When an infected premise is reported, the duration period from infectiousness to detection,
  , is assessed by experts based on symptom observation. This assessment is called
  .
.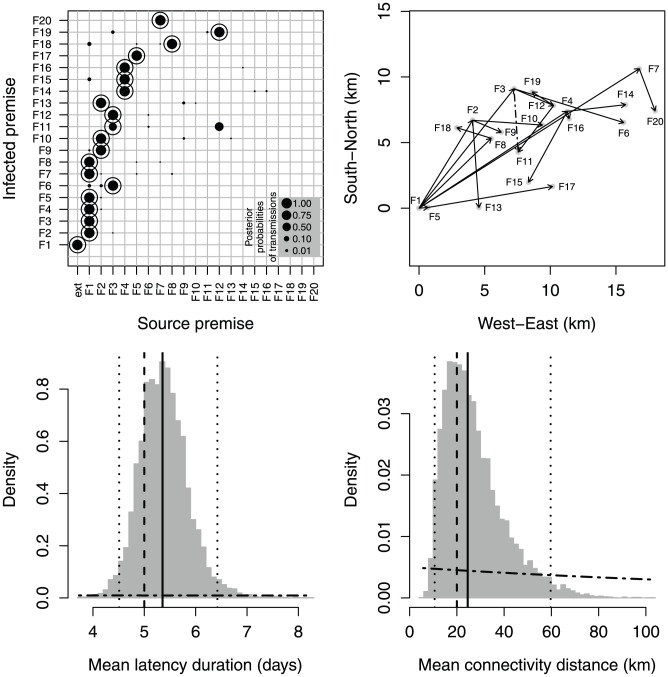
 is not consistent with the true tree (the true transmission is
  dashed arrow). Bottom: posterior distributions (histograms) of mean latency duration (
 ; left) and mean transmission distance (
 ; right); dashed lines: true values; dotted-dashed curves: prior distributions; solid lines: posterior medians; dotted lines: posterior quantiles 0.025 and 0.975.
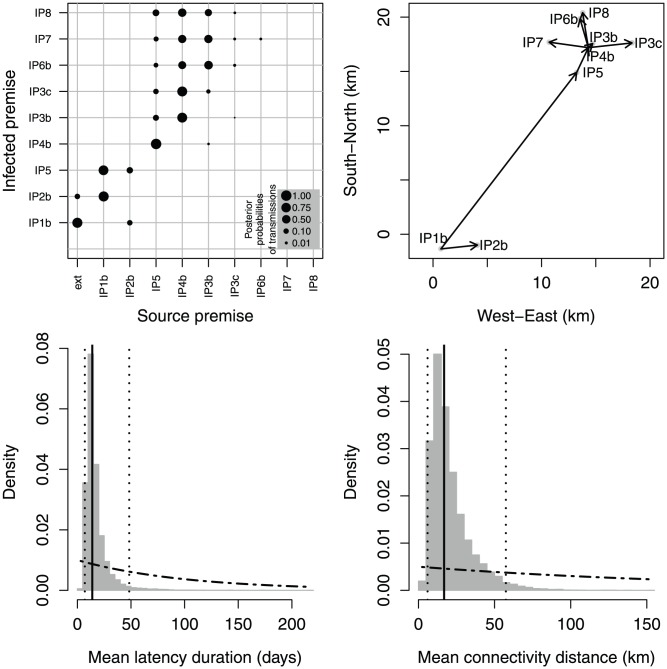
 ; left) and mean transmission distance (
 ; right); dotted-dashed curves: prior distributions; solid lines: posterior medians; dotted lines: posterior quantiles 0.025 and 0.975.
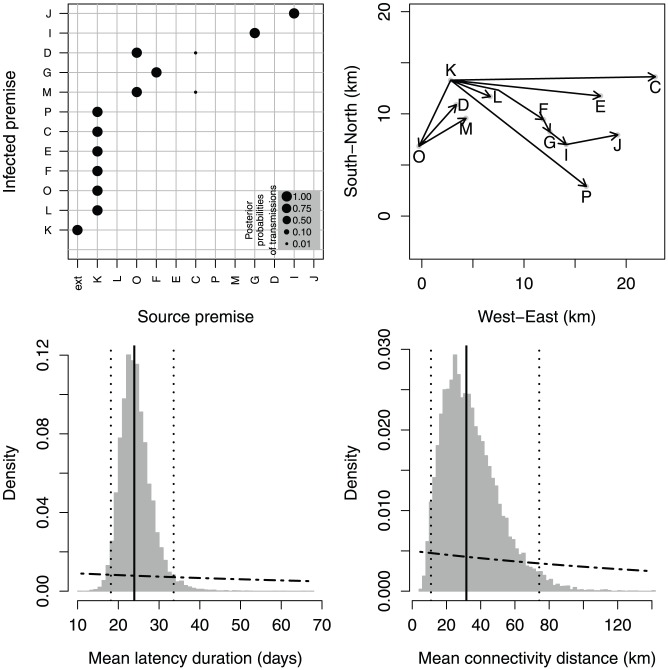
 ; left) and mean transmission distance (
 ; right); dotted-dashed curves: prior distributions; solid lines: posterior medians; dotted lines: posterior quantiles 0.025 and 0.975.
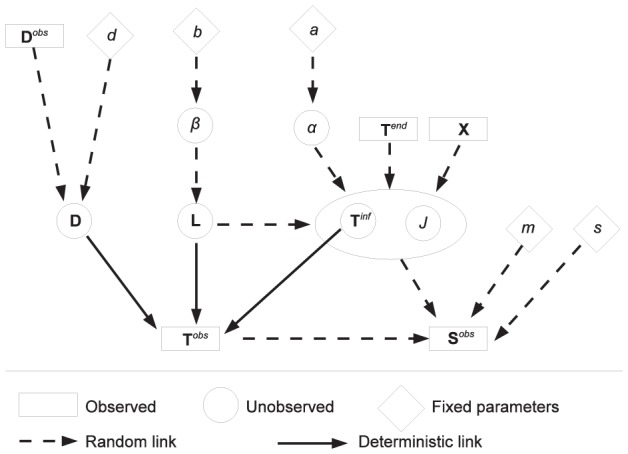
 . For a full description of the symbols, see Table 2.
References
-
- Ferguson NM, Donnelly CA, Anderson RM (2001) Transmission intensity and impact of control policies on the foot and mouth epidemic in great britain. Nature 413: 542–548. - PubMed
-
- Keeling MJ, Woolhouse MEJ, May RM, Davies G, Grenfell BT (2003) Modelling vaccination strategies against foot-and-mouth disease. Nature 421: 136–142. - PubMed
-
- Metzker ML (2010) Sequencing technologies - the next generation. Nat Rev Genet 11: 31–46. - PubMed
Publication types
MeSH terms
Grants and funding
- BB/I013784/1/BB_/Biotechnology and Biological Sciences Research Council/United Kingdom
- G0901135/MRC_/Medical Research Council/United Kingdom
- BB/I014314/1/BB_/Biotechnology and Biological Sciences Research Council/United Kingdom
- BB/F005733/1/BB_/Biotechnology and Biological Sciences Research Council/United Kingdom
LinkOut - more resources
Full Text Sources
Other Literature Sources
