

Genomic study of RNA polymerase II and III SNAPc-bound promoters reveals a gene transcribed by both enzymes and a broad use of common activators
- PMID: 23166507
- PMCID: PMC3499247
- DOI: 10.1371/journal.pgen.1003028
Genomic study of RNA polymerase II and III SNAPc-bound promoters reveals a gene transcribed by both enzymes and a broad use of common activators
Abstract
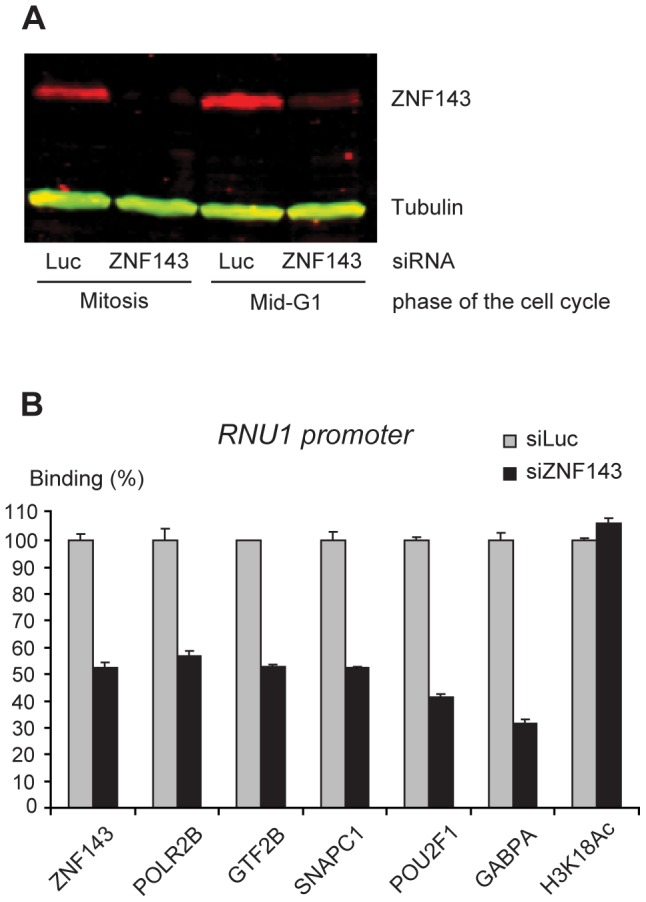
SNAP(c) is one of a few basal transcription factors used by both RNA polymerase (pol) II and pol III. To define the set of active SNAP(c)-dependent promoters in human cells, we have localized genome-wide four SNAP(c) subunits, GTF2B (TFIIB), BRF2, pol II, and pol III. Among some seventy loci occupied by SNAP(c) and other factors, including pol II snRNA genes, pol III genes with type 3 promoters, and a few un-annotated loci, most are primarily occupied by either pol II and GTF2B, or pol III and BRF2. A notable exception is the RPPH1 gene, which is occupied by significant amounts of both polymerases. We show that the large majority of SNAP(c)-dependent promoters recruit POU2F1 and/or ZNF143 on their enhancer region, and a subset also recruits GABP, a factor newly implicated in SNAP(c)-dependent transcription. These activators associate with pol II and III promoters in G1 slightly before the polymerase, and ZNF143 is required for efficient transcription initiation complex assembly. The results characterize a set of genes with unique properties and establish that polymerase specificity is not absolute in vivo.
Conflict of interest statement
The authors have declared that no competing interests exist.
Figures


Similar articles
-
Mechanism of selective recruitment of RNA polymerases II and III to snRNA gene promoters.Genes Dev. 2018 May 1;32(9-10):711-722. doi: 10.1101/gad.314245.118. Epub 2018 May 21. Genes Dev. 2018. PMID: 29785964 Free PMC article.
-
Structure-function analysis of the human TFIIB-related factor II protein reveals an essential role for the C-terminal domain in RNA polymerase III transcription.Mol Cell Biol. 2005 Nov;25(21):9406-18. doi: 10.1128/MCB.25.21.9406-9418.2005. Mol Cell Biol. 2005. PMID: 16227591 Free PMC article.
-
Regulation of snRNA gene expression by the Drosophila melanogaster small nuclear RNA activating protein complex (DmSNAPc).Crit Rev Biochem Mol Biol. 2011 Feb;46(1):11-26. doi: 10.3109/10409238.2010.518136. Epub 2010 Oct 6. Crit Rev Biochem Mol Biol. 2011. PMID: 20925482 Review.
-
A shared surface of TBP directs RNA polymerase II and III transcription via association with different TFIIB family members.Mol Cell. 2003 Jan;11(1):151-61. doi: 10.1016/s1097-2765(02)00797-9. Mol Cell. 2003. PMID: 12535529
-
How to Recruit the Correct RNA Polymerase? Lessons from snRNA Genes.Trends Genet. 2019 Jun;35(6):457-469. doi: 10.1016/j.tig.2019.04.001. Epub 2019 Apr 27. Trends Genet. 2019. PMID: 31040056 Review.
Cited by
-
Specific genomic cues regulate Cajal body assembly.RNA Biol. 2017 Jun 3;14(6):791-803. doi: 10.1080/15476286.2016.1243648. Epub 2016 Oct 7. RNA Biol. 2017. PMID: 27715441 Free PMC article. Review.
-
RNA Polymerase III Advances: Structural and tRNA Functional Views.Trends Biochem Sci. 2016 Jun;41(6):546-559. doi: 10.1016/j.tibs.2016.03.003. Epub 2016 Apr 8. Trends Biochem Sci. 2016. PMID: 27068803 Free PMC article. Review.
-
Differential phosphorylation of a regulatory subunit of protein kinase CK2 by target of rapamycin complex 1 signaling and the Cdc-like kinase Kns1.J Biol Chem. 2015 Mar 13;290(11):7221-33. doi: 10.1074/jbc.M114.626523. Epub 2015 Jan 28. J Biol Chem. 2015. PMID: 25631054 Free PMC article.
-
Modulation of gene expression via overlapping binding sites exerted by ZNF143, Notch1 and THAP11.Nucleic Acids Res. 2013 Apr;41(7):4000-14. doi: 10.1093/nar/gkt088. Epub 2013 Feb 13. Nucleic Acids Res. 2013. PMID: 23408857 Free PMC article.
-
Molecular basis of neurodegeneration in a mouse model of Polr3-related disease.bioRxiv [Preprint]. 2024 Jul 2:2023.12.12.571310. doi: 10.1101/2023.12.12.571310. bioRxiv. 2024. Update in: Elife. 2024 Nov 05;13:RP95314. doi: 10.7554/eLife.95314. PMID: 38168294 Free PMC article. Updated. Preprint.
References
-
- Hernandez N (2001) Small nuclear RNA genes: a model system to study fundamental mechanisms of transcription. J Biol Chem 276: 26733–26736. - PubMed
-
- Teichmann M, Wang Z, Roeder RG (2000) A stable complex of a novel transcription factor IIB- related factor, human TFIIIB50, and associated proteins mediate selective transcription by RNA polymerase III of genes with upstream promoter elements. Proc Natl Acad Sci U S A 97: 14200–14205. - PMC - PubMed
Publication types
MeSH terms
Substances
Associated data
- Actions
LinkOut - more resources
Full Text Sources
Molecular Biology Databases
