. 2012;8(11):e1003059.
doi: 10.1371/journal.pgen.1003059. Epub 2012 Nov 15.

Lamin b1 polymorphism influences morphology of the nuclear envelope, cell cycle progression, and risk of neural tube defects in mice

Affiliations

Lamin b1 polymorphism influences morphology of the nuclear envelope, cell cycle progression, and risk of neural tube defects in mice

Sandra C P De Castro et al. PLoS Genet. 2012.

Abstract

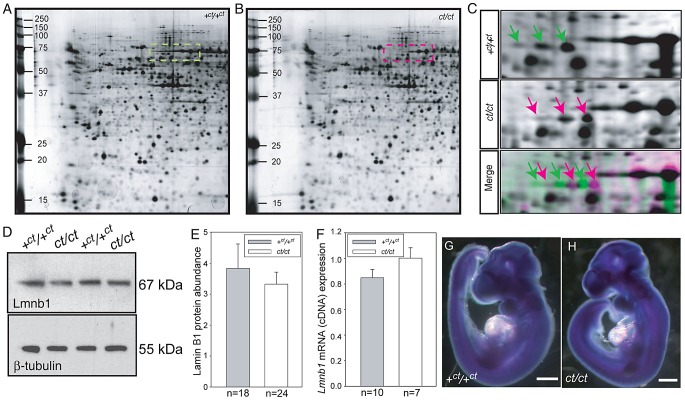
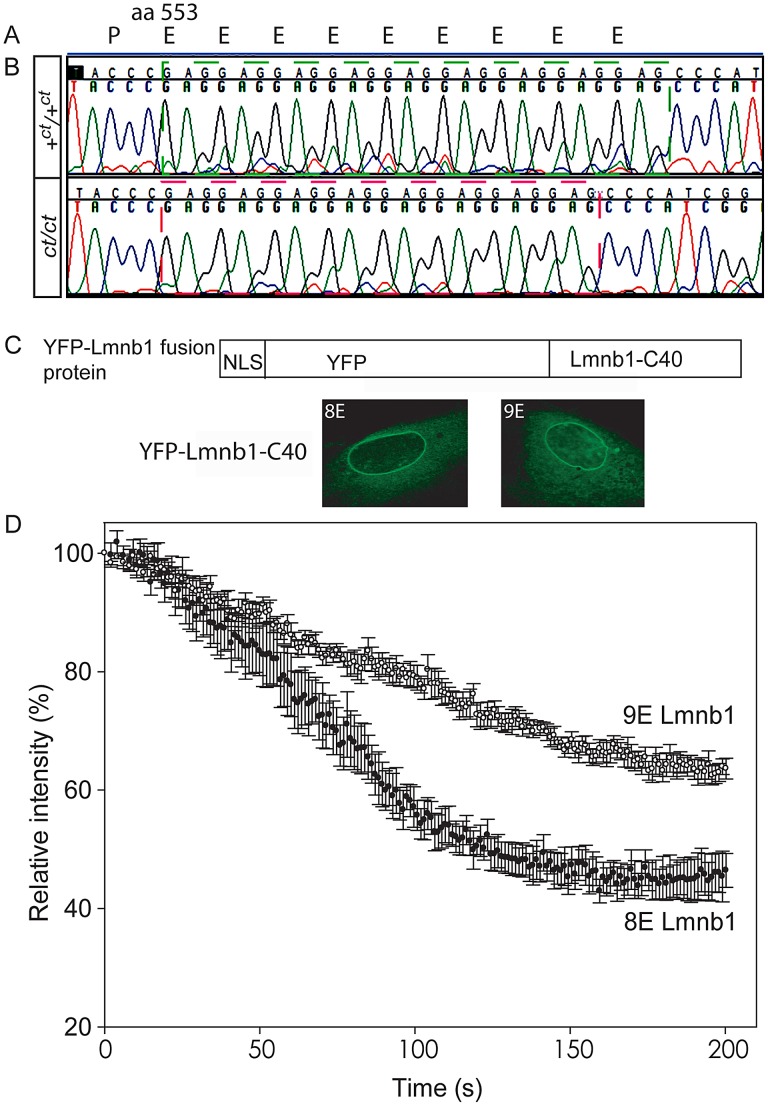
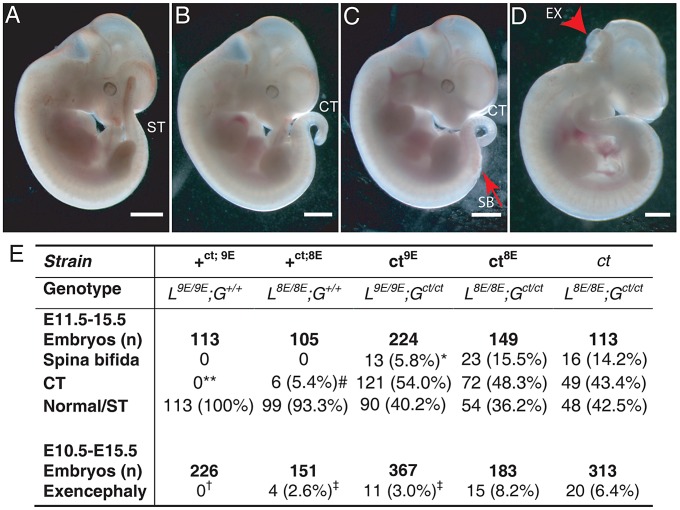
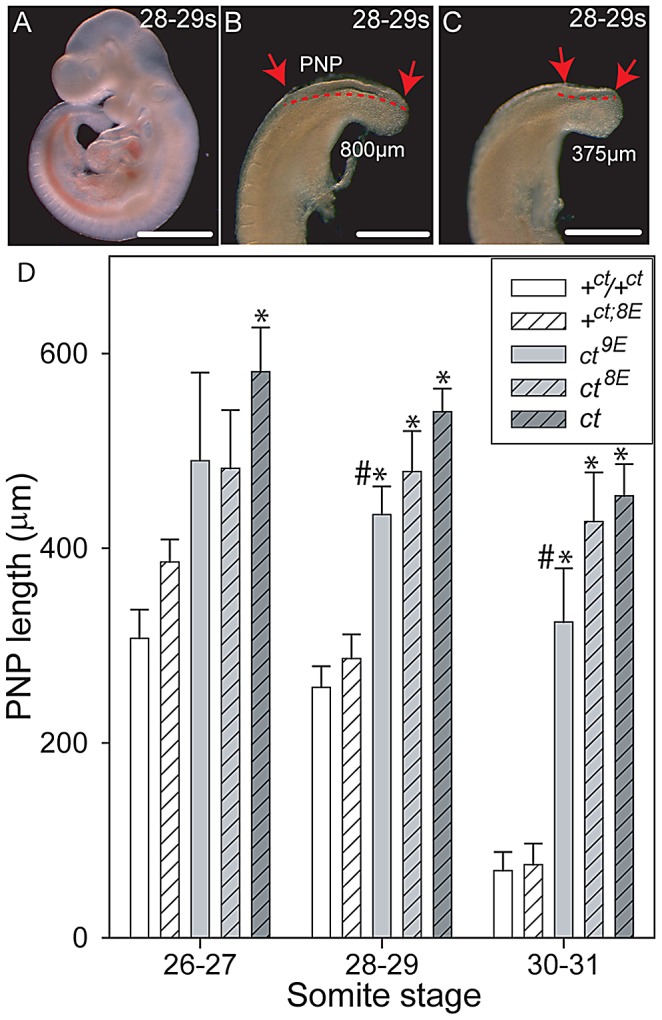
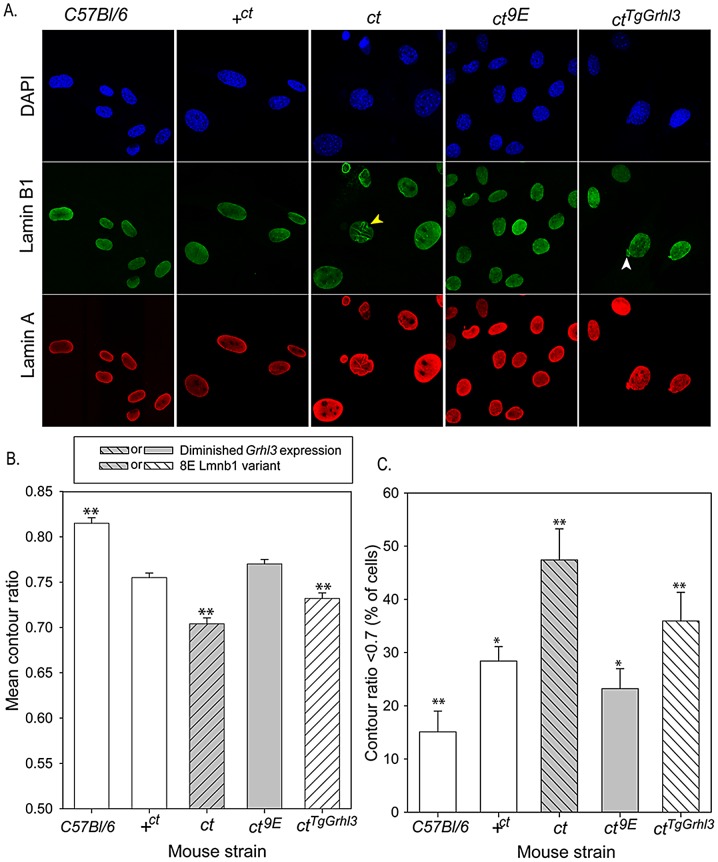
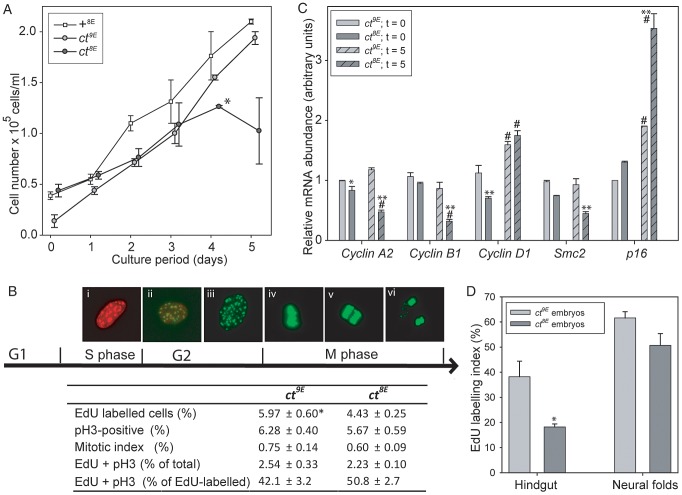
Neural tube defects (NTDs), including spina bifida and anencephaly, are common birth defects whose complex multigenic causation has hampered efforts to delineate their molecular basis. The effect of putative modifier genes in determining NTD susceptibility may be investigated in mouse models, particularly those that display partial penetrance such as curly tail, a strain in which NTDs result from a hypomorphic allele of the grainyhead-like-3 gene. Through proteomic analysis, we found that the curly tail genetic background harbours a polymorphic variant of lamin B1, lacking one of a series of nine glutamic acid residues. Lamins are intermediate filament proteins of the nuclear lamina with multiple functions that influence nuclear structure, cell cycle properties, and transcriptional regulation. Fluorescence loss in photobleaching showed that the variant lamin B1 exhibited reduced stability in the nuclear lamina. Genetic analysis demonstrated that the variant also affects neural tube closure: the frequency of spina bifida and anencephaly was reduced three-fold when wild-type lamin B1 was bred into the curly tail strain background. Cultured fibroblasts expressing variant lamin B1 show significantly increased nuclear dysmorphology and diminished proliferative capacity, as well as premature senescence, associated with reduced expression of cyclins and Smc2, and increased expression of p16. The cellular basis of spinal NTDs in curly tail embryos involves a proliferation defect localised to the hindgut epithelium, and S-phase progression was diminished in the hindgut of embryos expressing variant lamin B1. These observations indicate a mechanistic link between altered lamin B1 function, exacerbation of the Grhl3-mediated cell proliferation defect, and enhanced susceptibility to NTDs. We conclude that lamin B1 is a modifier gene of major effect for NTDs resulting from loss of Grhl3 function, a role that is likely mediated via the key function of lamin B1 in maintaining integrity of the nuclear envelope and ensuring normal cell cycle progression.


Conflict of interest statement

The authors have declared that no competing interests exist.

Figures

Figure 1
Figure 1. Lamin B1 shows differential protein migration by two-dimensional gel electrophoresis in curly tail and wild-type embryo samples.
Protein profiles of the caudal region of stage-matched wild-type (A) and curly tail (B) embryos analysed by 2-DE (representative gels shown encompass pH 3.0–5.6 on the x-axis, basic pH to the right). A series of silver-stained protein spots exhibits a different migration pattern (C: enlarged area of gel corresponds to dashed box in A and B). On 2-DE of ct/ct samples, spots (pink arrows and pink spots on merged image) migrate to a more basic position than the corresponding spots on +ct/+ct gels (green arrows and green spots on merged image). Spots whose migration does not differ between samples appear black on the merged image. Western blot (D–E) and qRT-PCR (F) of protein and mRNA samples from the caudal region of +ct/+ct and ct/ct embryos at E10.5 show no significant difference between strains in relative abundance of either lamin B1 protein (normalised to beta-tubulin; arbitrary units) or mRNA (normalised to Gapdh with one wild-type sample chosen as calibrator; value set to 1.0). Number of samples, n, is shown on graphs. (G, H) The distribution of Lmnb1 mRNA at E10.5, as determined by whole mount in situ hybridisation is comparable in wild-type and ct/ct embryos (scale bar represents 1 mm).
Figure 2
Figure 2. Lamin B1 shows variation in length of glutamic acid repeat, which significantly affects mobility within the nuclear envelope.
(A) Lamin B1 protein sequence contains a series of Glu (E) residues beginning at amino acid 553, encoded at the genomic level by a GAG repeat. (B) The wild-type (+ct) sequence encodes nine E residues, whereas the curly tail sequence encodes only eight E residues (one fewer GAG). (C–D) Fluorescence loss in photobleaching (FLIP) was performed to examine the mobility of NLS-YFP-Lamin B1 tail domain fusion proteins, containing eight or nine Glu residues. (C) Fusion proteins are shown diagrammatically and localised to the nuclear envelope as expected. (D) The relative intensity of fluorescence in an unbleached region of the nuclear envelope compared with pre-bleaching (time 0) was determined. Mean intensity ± SEM is shown for five nuclei with each construct. There is a more rapid decline in intensity in cells expressing the 8E variant (red circles) compared with the 9E variant (open circles), and differences persist throughout the experiment. Statistical analysis shows a significant difference between the 8E and 9E variants at both the 100 s and 200 s time points (p<0.001, t-test).
Figure 3
Figure 3. The frequency of NTDs resulting from mutation of Grhl3 is affected by Lmnb1 genotype.
Embryos were scored as (A) apparently normal with a straight tail (ST), or with (B) a tail flexion defect (i.e. curly tail; CT), (C) spina bifida (SB) plus tail flexion defect, and/or (D) exencephaly (arrowhead indicates open hindbrain). Note that exencephaly can occur in association with any of the spinal phenotypes. Embryos shown are from the ct9E sub-strain. The frequency of NTD phenotypes is tabulated (E). The frequency of SB is significantly lower in the ct9E than in the ct8E and ct strains (* p<0.02, χ2 test). Spina bifida and tail flexion defects were never observed among +ct;9E embryos but tail flexion defects did occasionally occur among +ct;8E embryos (** +ct;9E versus +ct;8E; p<0.05; Z-test), although at significantly lower frequency than among ct mutant embryos (# p<0.001; χ2). There is significant variation in the frequency of exencephaly between the sub-strains (p<0.001; χ2) with a significantly lower exencephaly rate among ct9E than ct8E embryos ( significantly different from ct8E, p<0.01; Z-test). Exencephaly was not observed in the +ct;9E strain († indicates significant difference from ct and ct8E (p<0.001; Z-test) and ct9E (p<0.02) strains). Exencephaly was observed in the +ct;8E strain, albeit at a significantly lower frequency than in the ct8E strain ( p<0.05; Z-test).
Figure 4
Figure 4. Variation in mean PNP length of embryos of the curly tail sub-strains.
(A–C) Curly tail embryos at the 28–29 somite stage (E10.5), showing whole embryo (A) and enlarged views of two different caudal regions (B, C) to illustrate variable PNP lengths (between the arrows and indicated by dotted lines). An enlarged PNP (e.g. 800 µm length in B) is indicative of delay or failure of closure compared with a smaller PNP (e.g. 375 µm in C). Scale bars represent 1 mm in A and 0.5 mm in B, C. (D) PNP length measurements (mean in µm ± SEM) at somite stages around the time of PNP closure. At 28–29 and 30–31 somites, the mean PNP lengths of embryos of the ct, ct8E and ct9E strains (i.e. Grhl3 mutants; grey bars) are significantly larger than those of stage-matched embryos wild-type at the Grhl3 locus (i.e. +ct and +ct;8E; white bars), regardless of Lmnb1 genotype (* significantly different from Grhl3 wild-type strains, p<0.001; ANOVA and Holm-Sidak pairwise comparisons). This difference is also observed for the ct strain at the 26–27 somite stage. At each stage, the mean PNP length of +ct8E embryos is larger than for +ct embryos, but this difference does not reach statistical significance. Among ct sub-strains, embryos carrying the Lmnb19E allele had the smallest PNP lengths at each stage analysed (# significantly different from ct strain; p<0.001). Number of embryos corresponding to each bar: n = 5–16 at the 26–27 somite stage; n = 14–66 at the 28–29 and 30–31 somite stages.
Figure 5
Figure 5. Nuclear morphology is influenced by Lamin B1 variation.
(A) MEFs derived from embryos of various genotypes were stained with DAPI (blue) and antibodies to lamin B1 (green) and lamin A (red) to highlight the nuclear lamina. Abnormalities observed include lobulations (yellow arrowhead) and herniations (white arrowhead). (B, C) Analysis of MEF nuclei reveals significant differences between sub-strains in (B) mean contour ratio and (C) percentage of nuclei with contour ratio lower than 0.7, which is considered dysmorphic (p<0.001; ANOVA). (B) Mean contour ratio (expressed as mean ± SEM) is significantly higher in C57BL/6 and significantly lower in ct than all other strains. (C) Compared with all other strains, ct has a significantly higher frequency of dysmorphic nuclei (47.4±5.8%) and C57BL/6 (15.1±3.9%) has significantly fewer dysmorphic nuclei (** significant difference from all other strains, p<0.01). The proportion of dysmorphic nuclei is lower in strains with the wild-type Lmnb19E allele, but higher than in C57BL/6; * indicates significantly different from all other strains (p<0.01 for comparison with C57Bl/6, ct and ctTgGrhl3 and p<0.05 for comparison with +ct or ct9E). Over-expression of Grhl3 partially normalises nuclear phenotype in the ctTgGrhl3 strain (despite presence of Lmnb18E variant as in ct). The mean contour ratio is significantly higher than in the ct strain but lower than in ct9E or +ct strains (** indicates significant difference compared with all other strains tested, p<0.01). Values are an average of 9–15 experiments, using 2–3 independent cell lines for each strain. Total number of cells analysed: 579 C57BL/6; 895 +ct; 757 ct; 882 ct9E; 837 ctTgGrhl3.
Figure 6
Figure 6. Cell cycle progression is impaired in curly tail cells and embryos expressing the Lmnb18E variant.
In cultured embryonic fibroblasts (A–C), analysis of growth curves (A) shows that ct8E cells proliferate significantly slower than ct9E cells (*p<0.05; multiple linear regression for days 0–4) and then undergo a ‘growth crisis’ after 4 days culture. (B) Cell cycle analysis was performed at day 0 (5 hours of culture) using EdU to label cells as they progress through S phase (Bi) and anti-phospho Histone H3 (pH 3) to label cells in G2/M (Bii–vi). Mitotis was scored visually as cells that were in prophase, metaphase (Biv), anaphase (Bv) or telophase (Bvi). Data represents the mean of three experiments, each using an independent cell line, plated in triplicate. ct8E cells show significantly reduced EdU labelling (* p<0.05; t-test). There is a trend towards reduced pH 3 labelling and mitotic index in ct8E cells, but this difference is not statistically significant. The proportion of cells double-labelled with EdU and pH 3 (Bii) does not differ between ct8E and ct9E cells. (C) Expression of cell cycle regulators determined by qRT-PCR. For each gene, significant differences in the comparison of ct8E and ct9E cells cultured for the same period are indicated (* p<0.05, ** p<0.01; ANOVA with Holm-Sidak Pairwise Comparison). Expression differences between 0 and 5 days in culture for cells of the same genotype are indicated (# p<0.05). (D) Analysis of proliferation in embryos at E10.5 showed that EdU labeling index was significantly diminished in the hindgut of ct8E compared with ct9E embryos (* p<0.02; t-test).

Similar articles

Cited by

References

    1. Nadeau JH (2003) Modifier genes and protective alleles in humans and mice. Curr Opin Genet Dev 13: 290–295. - PubMed
    1. Copp AJ, Greene NDE (2010) Genetics and development of neural tube defects. J Pathol 220: 217–230. - PMC - PubMed
    1. Bassuk AG, Kibar Z (2009) Genetic basis of neural tube defects. Semin Pediatr Neurol 16: 101–110. - PubMed
    1. Greene NDE, Stanier P, Copp AJ (2009) Genetics of human neural tube defects. Hum Mol Genet 18: R113–R129. - PMC - PubMed
    1. Copp AJ, Greene NDE, Murdoch JN (2003) The genetic basis of mammalian neurulation. Nat Rev Genet 4: 784–793. - PubMed

Publication types

MeSH terms