. 2012;8(11):e1003078.
doi: 10.1371/journal.pgen.1003078. Epub 2012 Nov 15.

Polyadenylation-dependent control of long noncoding RNA expression by the poly(A)-binding protein nuclear 1

Affiliations

Polyadenylation-dependent control of long noncoding RNA expression by the poly(A)-binding protein nuclear 1

Yves B Beaulieu et al. PLoS Genet. 2012.

Abstract

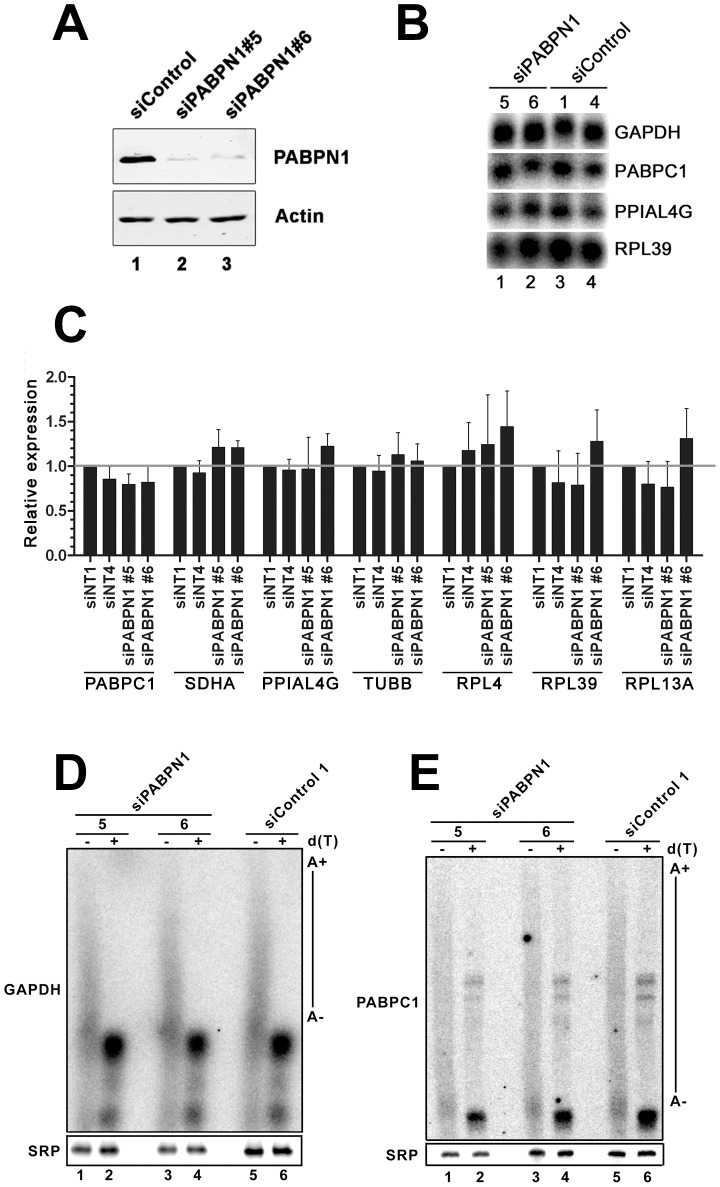
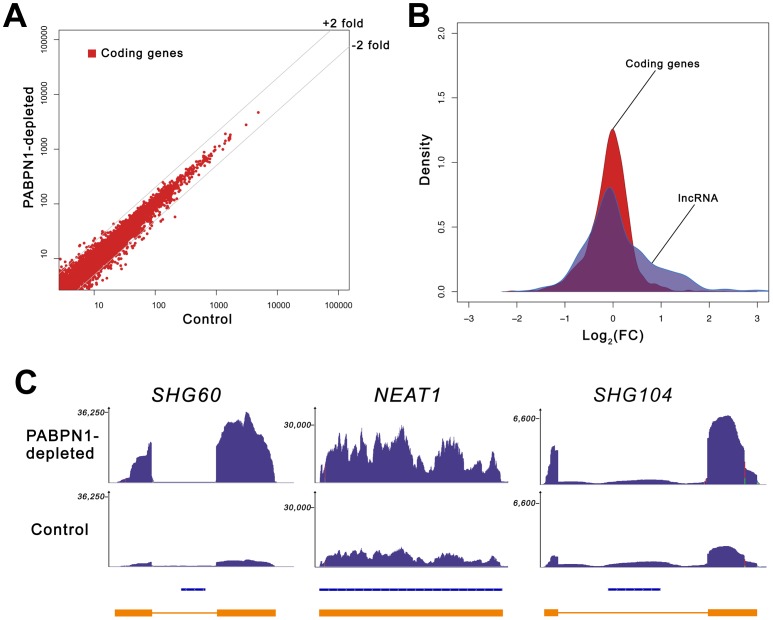
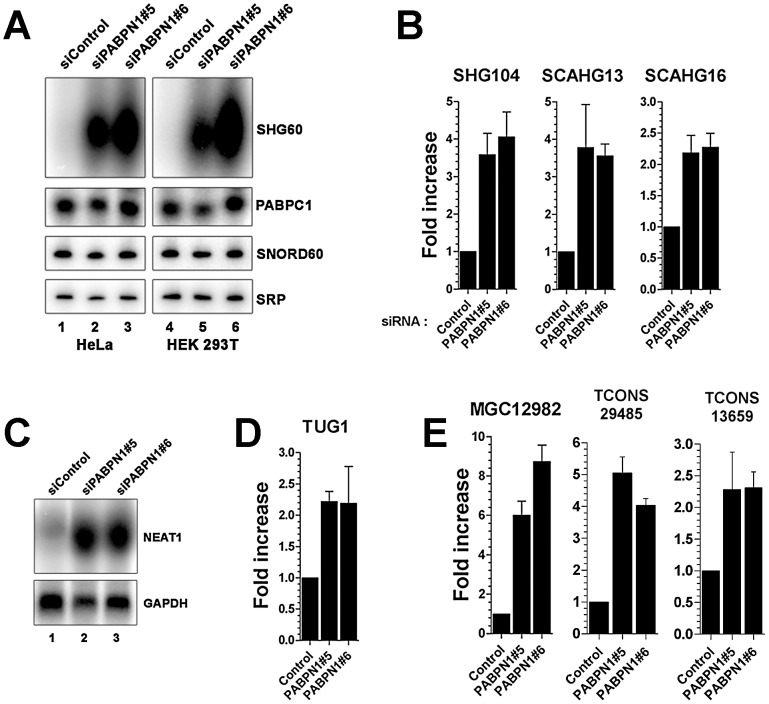
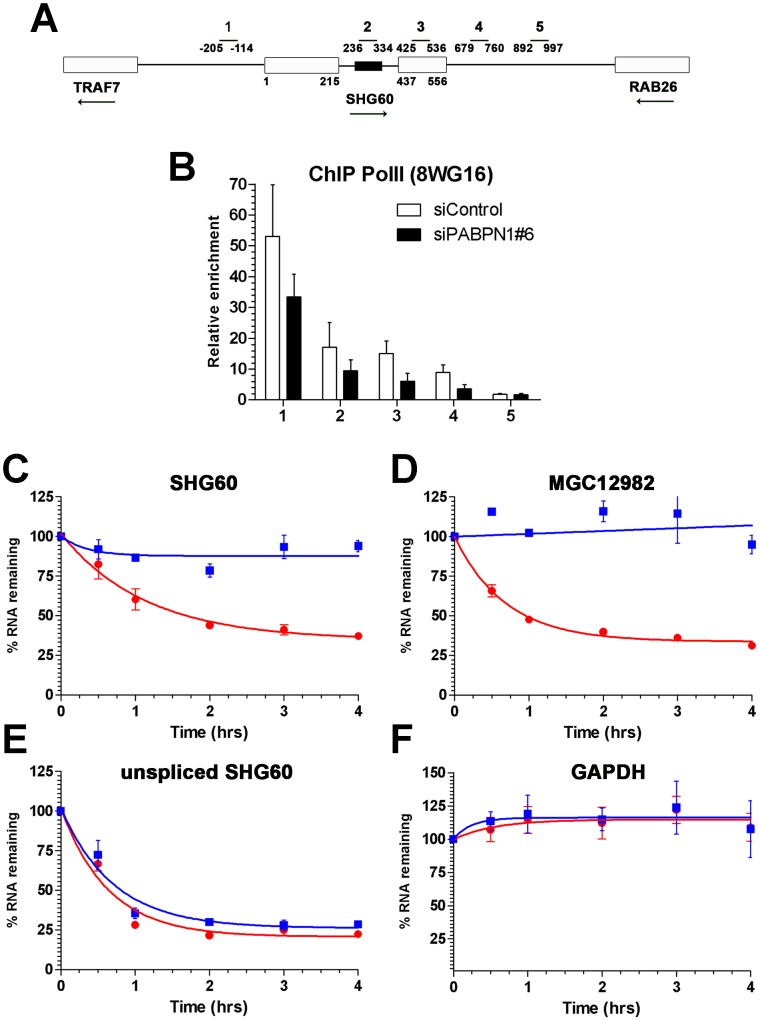
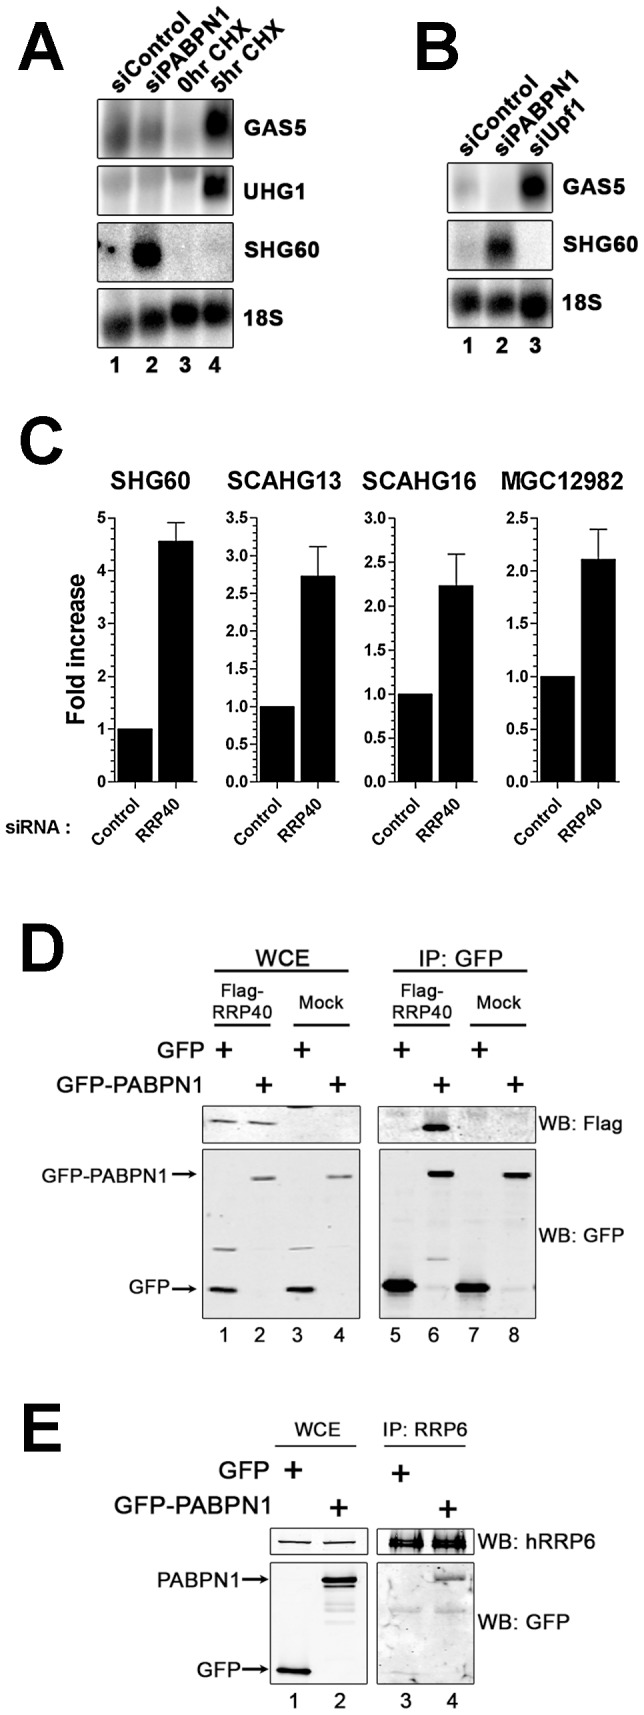
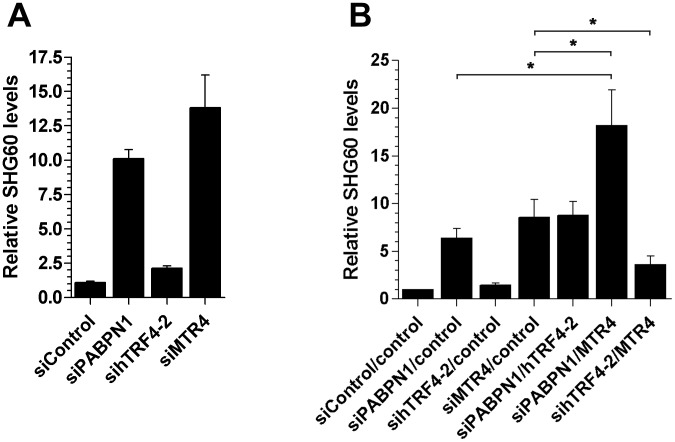
The poly(A)-binding protein nuclear 1 (PABPN1) is a ubiquitously expressed protein that is thought to function during mRNA poly(A) tail synthesis in the nucleus. Despite the predicted role of PABPN1 in mRNA polyadenylation, little is known about the impact of PABPN1 deficiency on human gene expression. Specifically, it remains unclear whether PABPN1 is required for general mRNA expression or for the regulation of specific transcripts. Using RNA sequencing (RNA-seq), we show here that the large majority of protein-coding genes express normal levels of mRNA in PABPN1-deficient cells, arguing that PABPN1 may not be required for the bulk of mRNA expression. Unexpectedly, and contrary to the view that PABPN1 functions exclusively at protein-coding genes, we identified a class of PABPN1-sensitive long noncoding RNAs (lncRNAs), the majority of which accumulated in conditions of PABPN1 deficiency. Using the spliced transcript produced from a snoRNA host gene as a model lncRNA, we show that PABPN1 promotes lncRNA turnover via a polyadenylation-dependent mechanism. PABPN1-sensitive lncRNAs are targeted by the exosome and the RNA helicase MTR4/SKIV2L2; yet, the polyadenylation activity of TRF4-2, a putative human TRAMP subunit, appears to be dispensable for PABPN1-dependent regulation. In addition to identifying a novel function for PABPN1 in lncRNA turnover, our results provide new insights into the post-transcriptional regulation of human lncRNAs.


Conflict of interest statement

The authors have declared that no competing interests exist.

Figures

Figure 1
Figure 1. Expression and polyadenylation of housekeeping genes in PABPN1–depleted cells.
(A) Western blot analysis of total extracts prepared from HeLa cells treated with PABPN1–specific (lanes 2–3) and control (lane 1) siRNAs for 72 hrs. (B) Northern blot analysis of total RNA prepared from HeLa cells treated with PABPN1–specific siRNAs (siRNA #5 and #6: lanes 1–2) and control siRNA (siRNA #1 and #4: lanes 3–4) for 72 hrs. The blot was probed for the GAPDH, PABPC1, peptidylprolyl isomerase A-like 4A (PPIAL4G), and ribosomal protein L39 (RPL39) mRNAs. (C) The expression levels of seven human genes were analyzed using real-time quantitative PCR in cells treated with control (siNT1 and siNT4) and PABPN1–specific (si#5 and si#6) siRNAs. The expression levels are relative to siNT1-treated cells and normalized to the GAPDH mRNA. The data and error bars represent the average and standard deviation from three independent experiments. (D–E) Total RNA prepared from HEK293T cells treated with PABPN1–specific siRNAs (siRNA#5: lanes 1–2; siRNA#6: lanes 3–4) and control siRNA#1 (lanes 5–6) siRNAs was treated with RNase H in the presence of DNA oligonucleotides complementary to 3′UTR sequences of the GAPDH (D) and PABPC1 (E) mRNAs. RNase H reactions were performed in the presence (+) and absence (−) of oligo d(T). The signal recognition particle (SRP) RNA was used as a loading control.
Figure 2
Figure 2. Loss of PABPN1 induces specific changes in gene expression.
(A) Comparison of gene expression changes in PABPN1–depleted (y-axis) and control (x-axis) cells, measured in reads per kilobase per million reads (RPKM). Coding genes (red dots) are defined as all UCSC genes with an associated protein ID. (B) Shown is the distribution of log ratios/fold-change (FC) in expression levels for protein-coding (red) and lncRNA (blue) genes using Kernel density estimation. The original histograms are shown in Figure S1. The set of lncRNA genes comprises all genes from the lincRNA catalog , lncRNA database , and genes from the noncode database longer than 200-nt. (C) RNA-seq read distribution along three lncRNA genes for PABPN1–depleted (top row) and control (middle row) cells. Bottom row shows gene annotations for the corresponding regions: Refseq genes (blue) and inferred gene structure from RNA-seq data (orange). SHG60 and SHG104 (SNORD60 and SNORD104 Host Genes, respectively); NEAT1 (nuclear enriched abundant transcript 1).
Figure 3
Figure 3. Accumulation of lncRNAs in PABPN1–depleted cells.
(A) Northern blot analysis of total RNA prepared from HeLa (lanes 1–3) and HEK293T (lanes 4–6) cells treated with PABPN1–specific (lanes 2–3 and 5–6) and control (lanes 1 and 4) siRNAs. The blots were probed for the SHG60 lncRNA and the SNORD60 snoRNA. The PABPC1 mRNA and the signal recognition particle (SRP) RNA were used as loading controls. (B–E) PABPN1–sensitive lncRNAs identified by RNA-seq were confirmed by qRT-PCR (B, D, and E) and northern blot (C) by comparing RNA prepared from HeLa cells treated with control and PABPN1–specific siRNAs. Fold increases are relative to control siRNA and normalized to the GAPDH mRNA. The data and error bars represent the average and standard deviation from at least three independent experiments.
Figure 4
Figure 4. PABPN1 promotes lncRNA turnover.
(A) Schematic diagram of the SHG60 gene. White boxes represent exons and the small black box corresponds to the SNORD60 snoRNA located in the SHG60 intron. The TRAF7 and RAB26 protein-coding genes located upstream and downstream, respectively, of SHG60 are also shown. Nucleotides numbers are relative to the first nucleotide from exon 1 of SHG60. Bars above the gene show the position of PCR products used for analyses in ChIP assays and for identification in panel B. (B) ChIP assays were performed on extracts prepared from cells treated with control (white bars) and PABPN1–specific (black bars) siRNAs using a monoclonal antibody (8WG16) specific to RNA Pol II. The coprecipitating DNA was quantified by real-time PCR using gene-specific primer pairs located along the SHG60 gene (see panel A). ChIP data are presented as the fold enrichment of RNA Pol II relative to control purifications performed without antibody. Values represent the means of at least three independent experiments and bars correspond to standard deviations. (C–F) HeLa cells previously transfected with control (red circles) and PABPN1–specific (blue squares) siRNAs were treated with 5 µg/ml actinomycin D, and RNA was isolated at time zero and intervals thereafter indicated. RNA decay rates of the spliced SHG60 lncRNA (C), MGC12982 lncRNA (D), unspliced SHG60 transcripts (E), and GAPDH mRNA (F) were determined by quantitative RT-PCR analysis and normalized to the PABPC1 mRNA. The data and error bars represent the average and standard deviation from three independent experiments.
Figure 5
Figure 5. PABPN1–dependent RNA decay is polyadenylation-dependent.
(A) Immunoprecipitation (IP) experiments showing that the SHG60 lncRNA is enriched in PABPN1 precipitates, but not in a control purification. The GAPDH mRNA and the SRP noncoding RNA were used as controls. (B) RNA enrichments (IP∶input ratio) in PABPN1 and control purifications were determined by real-time RT-PCR for the SHG60 RNA, the GAPDH mRNA, and the SRP RNA. Fold changes are relative to the control actin IP and normalized to the SRP RNA. The data and error bars represent the average and standard deviation from four independent experiments. (C) Quantitative RT-PCR analysis of RNA prepared from HeLa cells that were previously treated or not treated with cordycepin for 2 h. Fold increases are relative to untreated cells and normalized to the nonpolyadenylated SRP RNA. The data and error bars represent the average and standard deviation from three independent experiments. * p<0.05; Student's t-test. (D) Schematic diagram of the SHG60 constructs. White rectangles represent the noncoding exons, whereas the black box corresponds to the intronic SNORD60. The arrow indicates the position of the polyadenylation site as determined by 3′ RACE. The RBZ and H2A grey boxes correspond to the ribozyme and H2A terminator sequences, respectively. (E) HeLa cells treated with PABPN1–specific and control siRNAs were transfected with the control vector (lanes 1–4) or DNA constructs that express normal (lanes 5–8), ribozyme-processed (lanes 9–12), and H2A-processed (lanes 13–16) SHG60 lncRNA. Total RNA was treated with RNase H in the presence (+) or absence (−) of oligo(dT) before northern analysis using a SHG60-specific probe. The position of exogenous and endogenous SHG60 lncRNA is indicated on the right. The SRP RNA was used as a loading control. (F) The AAUAAA hexamer sequence of the SHG60 poly(A) signal is shown in bold with the two different hexamer variants used shown above the AAUAAA hexamer. The arrow shows the position of the SHG60 polyadenylation site, as determined by 3′ RACE. (G) HeLa cells were transfected with DNA constructs that express AAUAAA (lanes 1–2), AAGAAA (lanes 3–4), and AGUACU (lanes 5–6) SHG60 lncRNA. Endogenous and exogenous SHG60 lncRNA were detected in PABPN1–expressing conditions as shown in E (lanes 5–6).
Figure 6
Figure 6. The RNA exosome, but not nonsense-mediated decay, contributes to PABPN1–dependent lncRNA decay.
(A) Northern blot analysis of RNA prepared from untreated (lane 3) and cycloheximide-treated (lane 4; 20 µg/ml) HEK293T cells, as well as from cells treated with PABPN1–specific (lane 2) and control (lane 1) siRNAs. The blot was probed for the GAS5, UHG1, and SHG60 noncoding transcripts. The 18S rRNA was used as a loading control. (B) Northern analysis of RNA prepared from cells treated with control (lane 1), PABPN1–specific (lane 2), and UPF1-specific (lane 3) siRNAs. The blot was probed for the GAS5, SHG60, and 18S RNAs. (C) Quantitative RT-PCR analysis of RNA prepared from HeLa cells treated with control and hRRP40-specific siRNAs using sequence-specific primers to the indicated genes. Fold increases are relative to control siRNA and normalized to GAPDH mRNA. The data and error bars represent the average and standard deviation from at least three independent experiments. (D) Western analysis of whole cell extract (WCE; lanes 1–4) and GFP immunoprecipiates (IP; lanes 5–8) prepared from HEK293T cells that stably express GFP (lanes 1, 3, 5, and 7) or GFP-PABPN1 (lanes 2, 4, 6, and 8) and that were previously transfected with the empty vector (lanes 3–4 and 7–8) or a construct that expressed a Flag-tagged version of the hRRP40 (lanes 1–2 and 5–6). Western analysis was performed using antibodies specific to Flag (upper panel) and GFP (bottom panel). (E) Western analysis of whole cell extract (WCE; lanes 1–2) and hRRP6 immunoprecipiates (IP; lanes 3–4) prepared from HEK293T cells that stably express GFP (lanes 1 and 3) and GFP-PABPN1 (lanes 2 and 4). Western analysis was performed using antibodies specific to endogenous hRRP6 (upper panel) and GFP (bottom panel).
Figure 7
Figure 7. Efficient turnover of a PABPN1–sensitive lncRNA does not require hTRF4-dependent polyadenylation.
(A) Total RNA from HeLa cells treated with the indicated siRNAs was analyzed by quantitative RT-PCR using primer pairs specific to SHG60. SHG60 lncRNA expression is relative to control siRNA and normalized to the GAPDH mRNA. The data and error bars represent the average and standard deviation from at least three independent experiments. (B) Total RNA from HeLa cells treated with the indicated combinations of siRNAs was analyzed by quantitative RT-PCR using primer pairs specific to SHG60. SHG60 expression is relative to cells treated with the combination of non-targeting siRNAs (control/control) and normalized to the GAPDH mRNA. The data and error bars represent the average and standard deviation from at least three independent experiments. (* p<0.05; Student's t-test).

Similar articles

Cited by

References

    1. Wahle E (1991) A novel poly(A)-binding protein acts as a specificity factor in the second phase of messenger RNA polyadenylation. Cell 66: 759–768. - PubMed
    1. Kuhn U, Nemeth A, Meyer S, Wahle E (2003) The RNA binding domains of the nuclear poly(A)-binding protein. J Biol Chem 278: 16916–16925. - PubMed
    1. Kerwitz Y, Kuhn U, Lilie H, Knoth A, Scheuermann T, et al. (2003) Stimulation of poly(A) polymerase through a direct interaction with the nuclear poly(A) binding protein allosterically regulated by RNA. Embo J 22: 3705–3714. - PMC - PubMed
    1. Kuhn U, Gundel M, Knoth A, Kerwitz Y, Rudel S, et al. (2009) Poly(A) tail length is controlled by the nuclear poly(A)-binding protein regulating the interaction between poly(A) polymerase and the cleavage and polyadenylation specificity factor. J Biol Chem 284: 22803–22814. - PMC - PubMed
    1. Kuhn U, Wahle E (2004) Structure and function of poly(A) binding proteins. Biochim Biophys Acta 1678: 67–84. - PubMed

Publication types