. 2012;7(11):e48865.
doi: 10.1371/journal.pone.0048865. Epub 2012 Nov 14.

From schooling to shoaling: patterns of collective motion in zebrafish (Danio rerio)

Affiliations

From schooling to shoaling: patterns of collective motion in zebrafish (Danio rerio)

Noam Miller et al. PLoS One. 2012.

Abstract

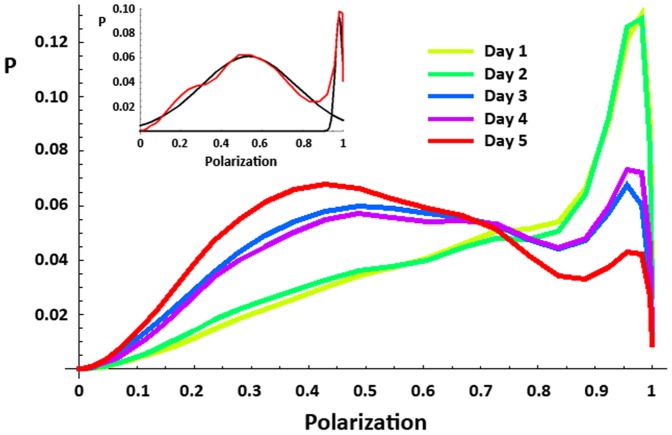
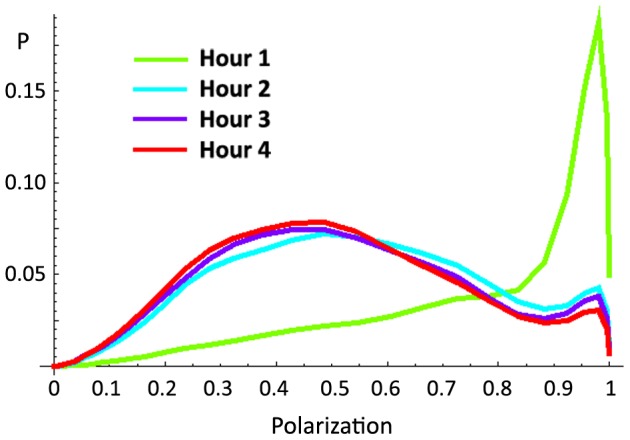
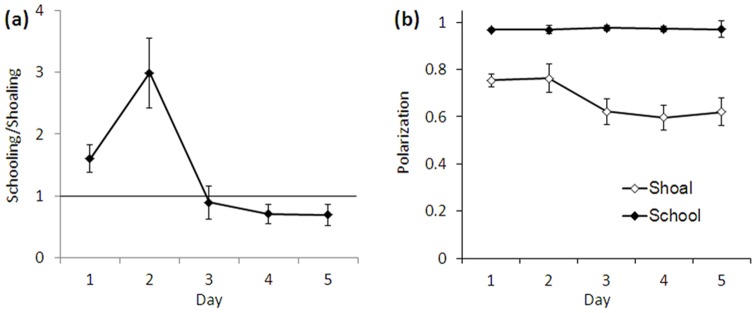
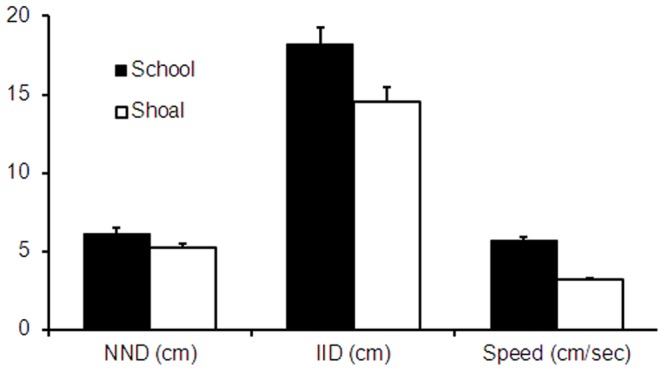
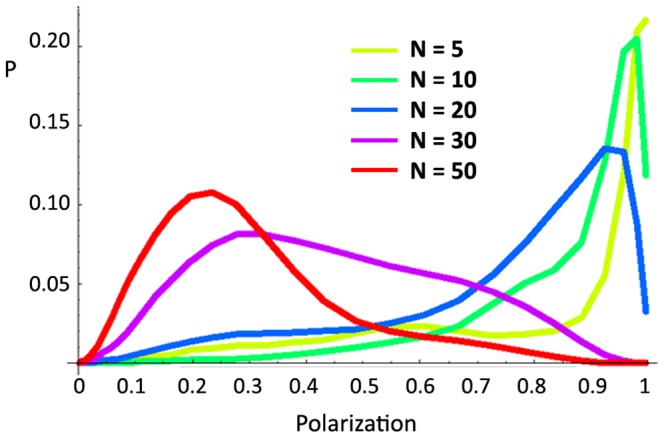
Animal groups on the move can take different configurations. For example, groups of fish can either be 'shoals' or 'schools': shoals are simply aggregations of individuals; schools are shoals exhibiting polarized, synchronized motion. Here we demonstrate that polarization distributions of groups of zebrafish (Danio rerio) are bimodal, showing two distinct modes of collective motion corresponding to the definitions of shoaling and schooling. Other features of the group's motion also vary consistently between the two modes: zebrafish schools are faster and less dense than zebrafish shoals. Habituation to an environment can also alter the proportion of time zebrafish groups spend schooling or shoaling. Models of collective motion suggest that the degree and stability of group polarization increases with the group's density. Examining zebrafish groups of different sizes from 5 to 50, we show that larger groups are less polarized than smaller groups. Decreased fearfulness in larger groups may function similarly to habituation, causing them to spend more time shoaling than schooling, contrary to most models' predictions.


Conflict of interest statement

Competing Interests: The authors have declared that no competing interests exist.

Figures

Figure 1
Figure 1. Density distributions of polarization by testing day for Experiment 1.
Summed polarization distributions for repeated exposures to the testing tank on consecutive days. Distributions are averaged across the entire session (1800 frames per session) and over all groups (24 groups of 8 fish each). As fish habituate to the tank across days they spend more time shoaling (low polarization) and less time schooling (high polarization; K-S test, days 1–2 vs. days 3–5, all p<0.0001; see Table S1). The inset shows a sample distribution from one complete session (1800 frames) (red) and its decomposition into schooling and shoaling modes (black), by fitting a Gaussian mixed model (see text). Note that each session's distribution was tested for bimodality independently.
Figure 2
Figure 2. Density distributions of polarization by hour for Experiment 2.
Summed polarization distributions for each hour of a single, 4 hour, exposure to the testing tank. Distributions are averaged across the entire session (1800 frames per session) and all groups (8 groups of 8 fish each). A similar effect of habituation is seen to that observed in Figure 1, with increased shoaling and decreased schooling as time passes (K-S test, hour 1 vs. hours 2–4, all p<0.001; see Table S2).
Figure 3
Figure 3. Ratio of the mean time spent schooling to shoaling (a) and mean modes of polarization distribution components (b) by testing day in Experiment 1.
Unimodal data distributions were excluded. Error bars represent ± SEM. The spike in time spent schooling on day 2 (a) is attributable to a few outlier sessions.
Figure 4
Figure 4. Differences in Nearest Neighbor Distance (NND), Inter-Individual Distance (IID), and mean speed between shoals and schools in Experiment 1 (means of 24 groups of 8 fish each).
All differences were significant (paired-sample t-test, all p<0.0001). Error bars represent ± SEM.
Figure 5
Figure 5. Density distributions of polarization by group size for Experiment 3.
Summed polarization distributions for each group size (N = 5, 10, 20, 30, and 50). Distributions are averaged across the entire session (1800 frames per session) and all groups (4 groups of each size). Larger groups are significantly less polarized than smaller groups (K-S test, all p<0.0001; see Table S3).

References

    1. Krause J, Ruxton GD (2002) Living in Groups. Oxford: Oxford University Press. 228 p.
    1. Shaw E (1978) Schooling fishes. Am Sci 66: 166–175.
    1. Pitcher TJ (1983) Heuristic definitions of fish shoaling behaviour. Anim Behav 31: 611–613.
    1. Pitcher TJ, Parrish JK (1993) Functions of shoaling behavior in teleosts. In: Pitcher TJ, editor. Behaviour of Teleost Fishes. London: Chapman & Hall. pp. 363–439.
    1. Bode NWF, Faria JJ, Franks DW, Krause J, Wood JA (2010) How perceived threat increases synchronization in collectively moving animal groups. Proc R Soc B 277: 3065–3070. - PMC - PubMed

Publication types