. 2012;7(11):e49210.
doi: 10.1371/journal.pone.0049210. Epub 2012 Nov 15.

Genome-wide survey and expression analysis of amino acid transporter gene family in rice (Oryza sativa L.)

Affiliations

Genome-wide survey and expression analysis of amino acid transporter gene family in rice (Oryza sativa L.)

Heming Zhao et al. PLoS One. 2012.

Abstract

Background: Amino acid transporters (AATs) that transport amino acids across cellular membranes are essential for plant growth and development. To date, a genome-wide overview of the AAT gene family in rice is not yet available.

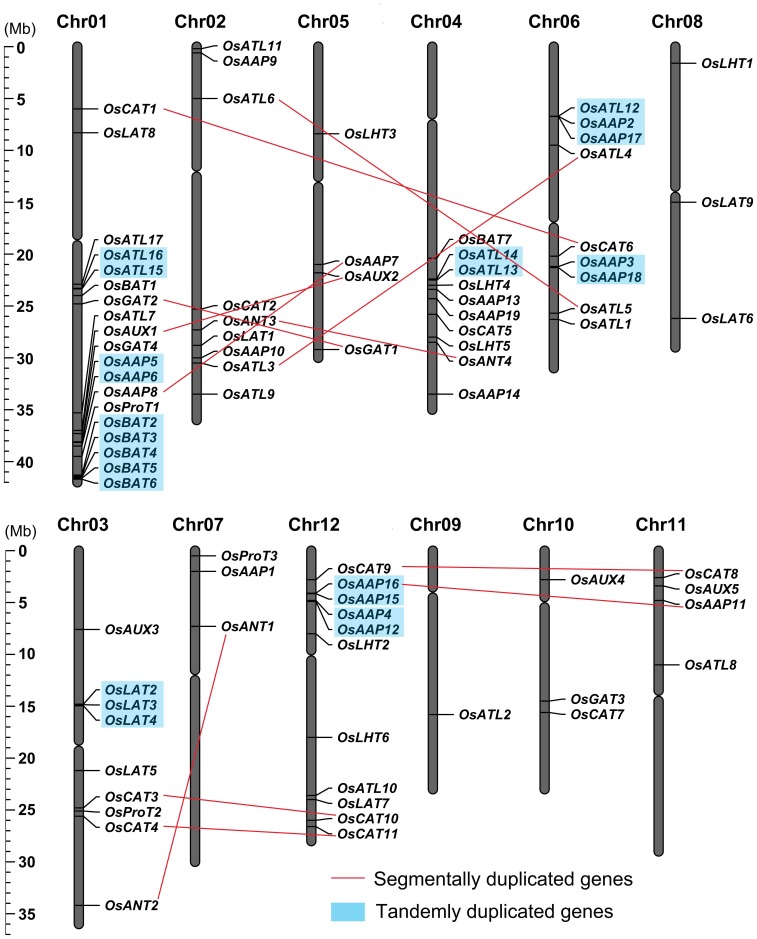
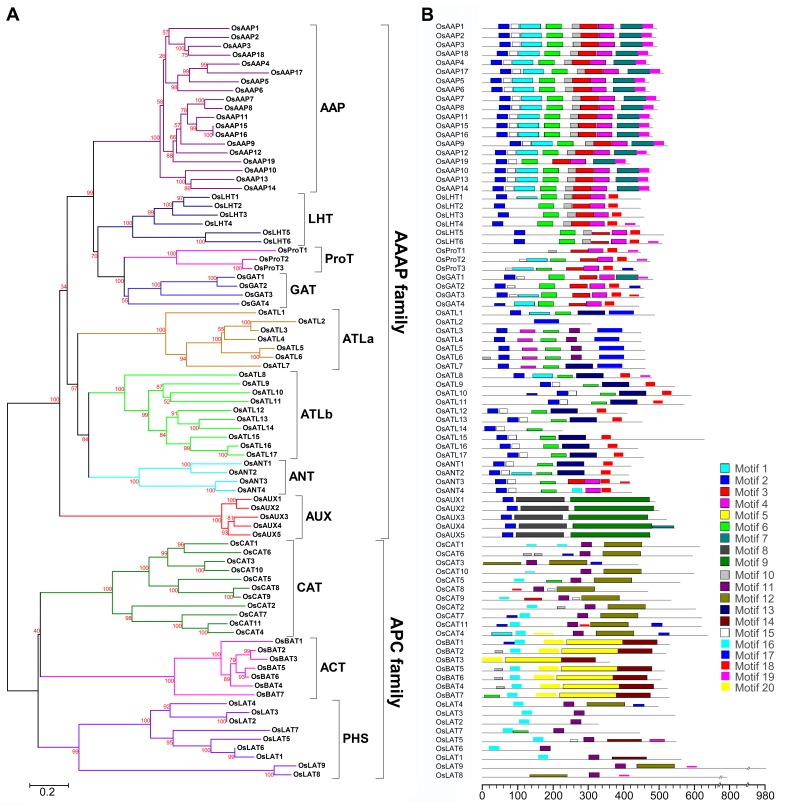
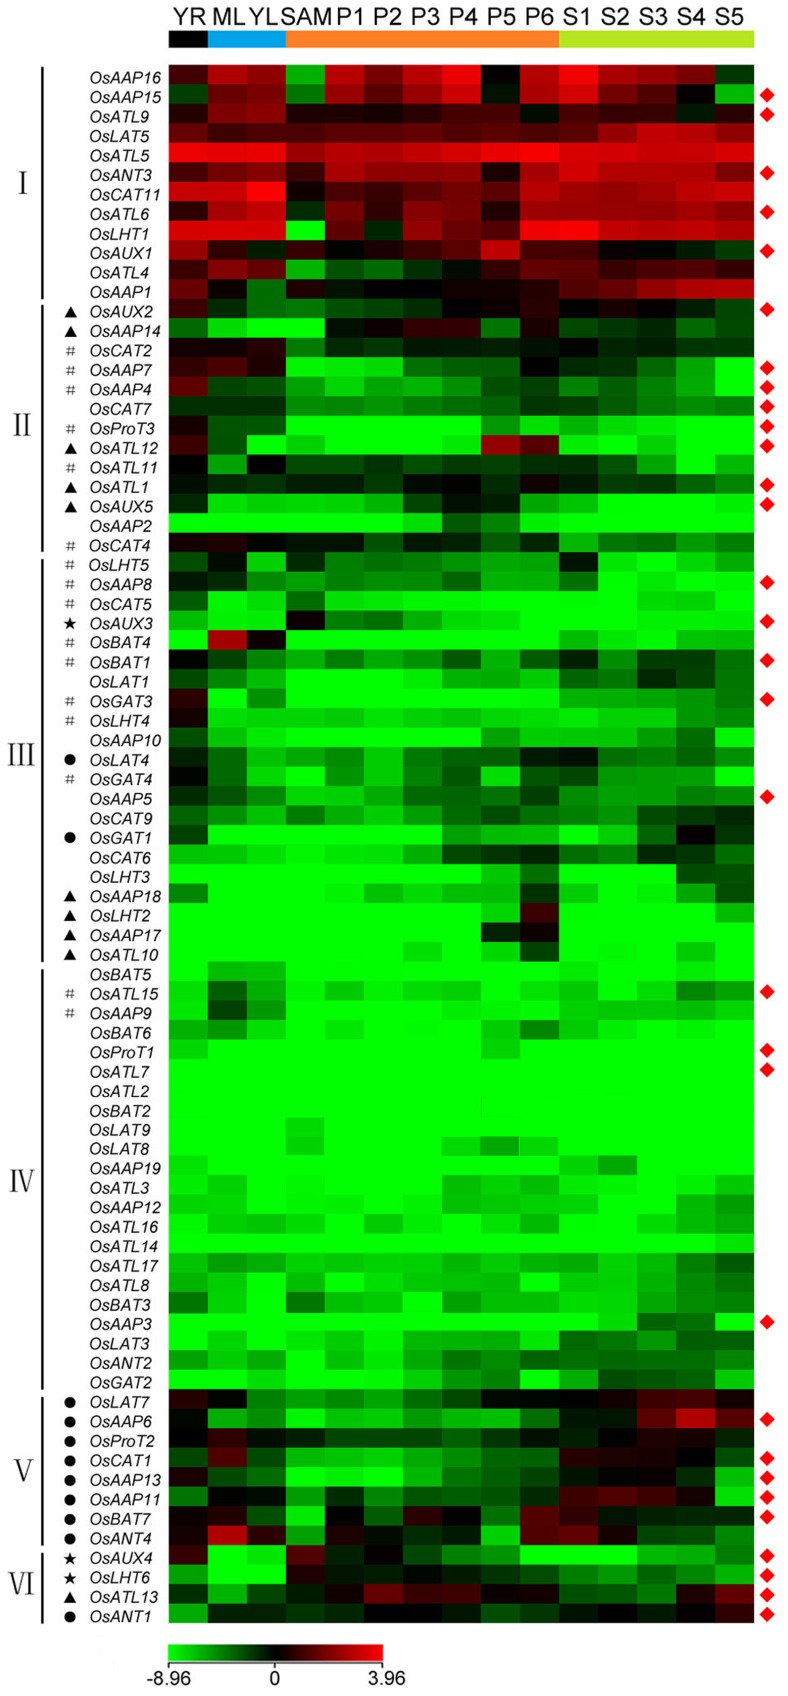
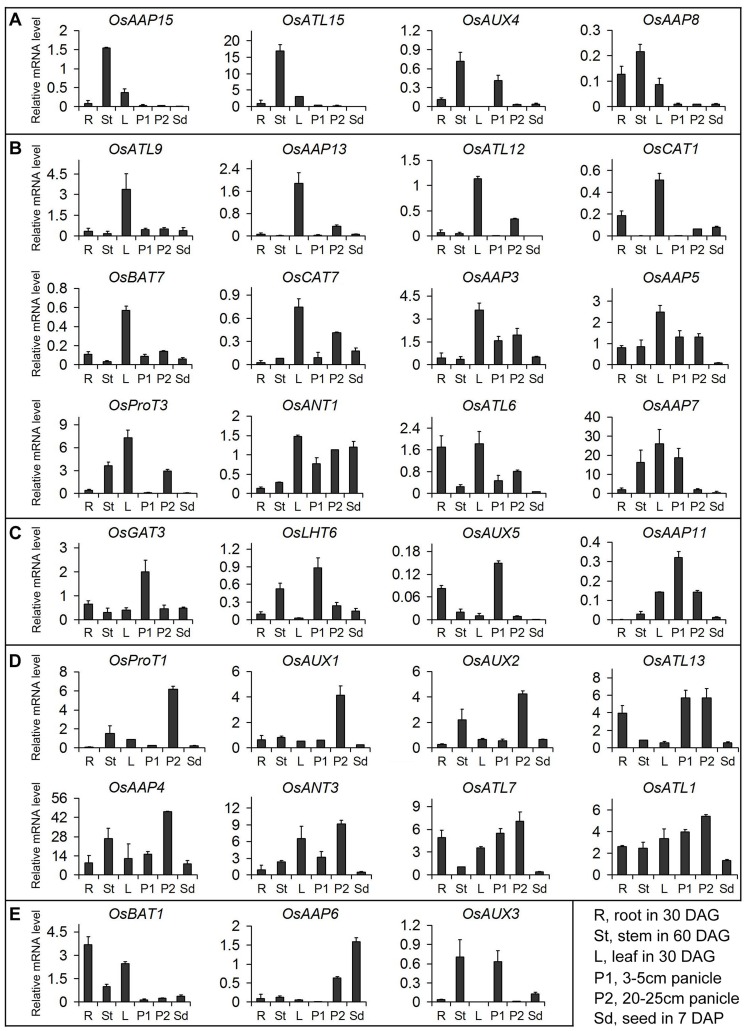
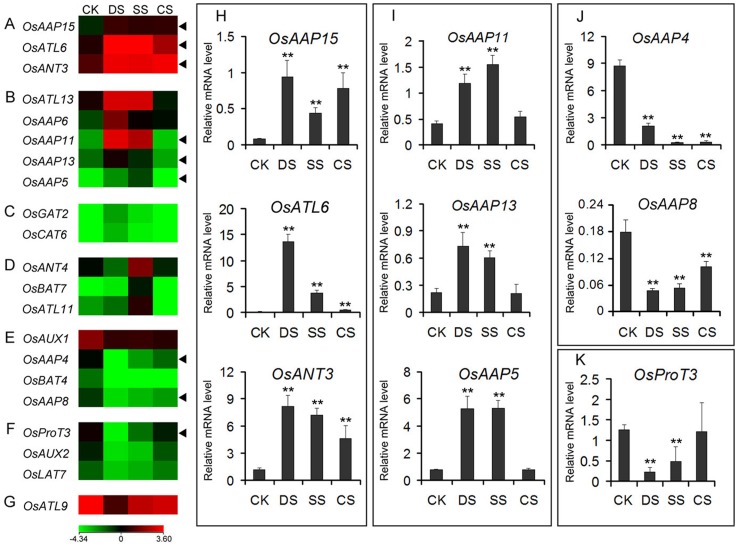
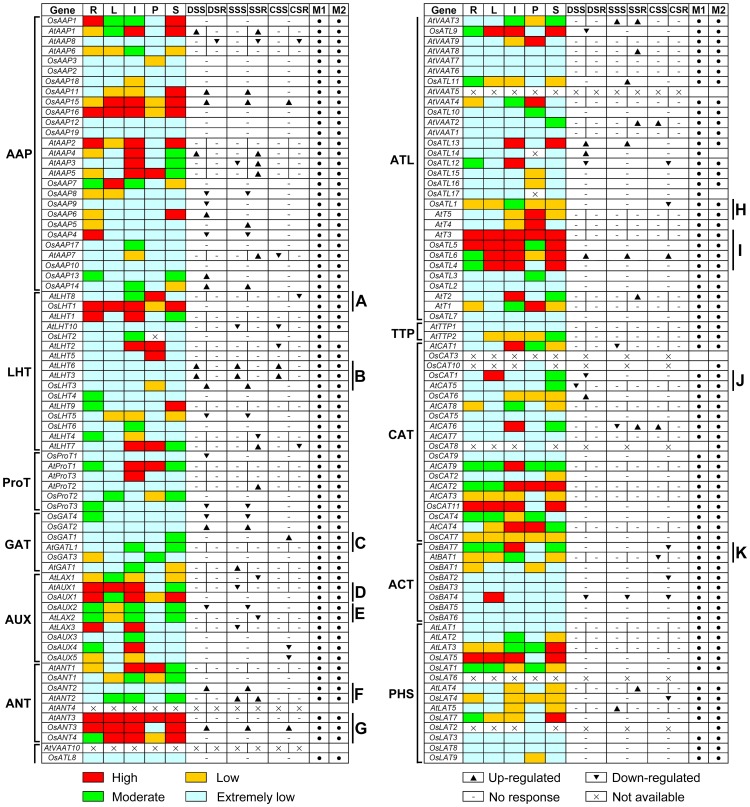
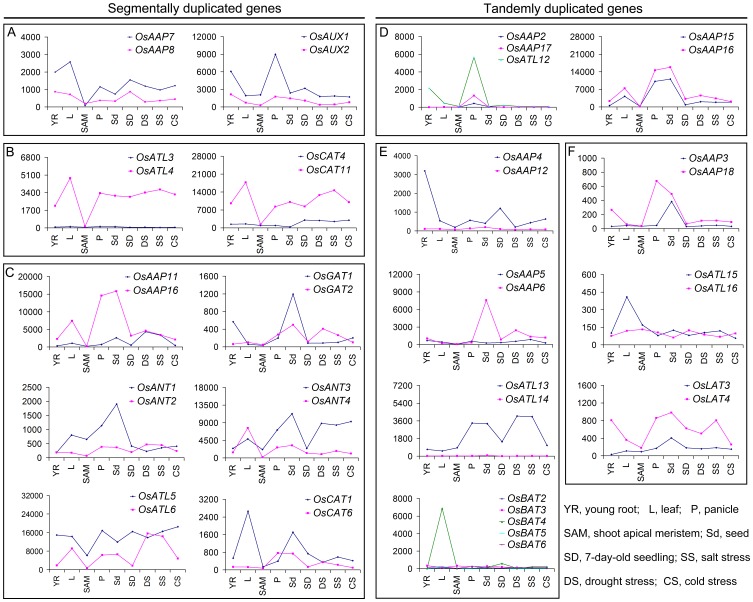
Methodology/principal findings: In this study, a total of 85 AAT genes were identified in rice genome and were classified into eleven distinct subfamilies based upon their sequence composition and phylogenetic relationship. A large number of OsAAT genes were expanded via gene duplication, 23 and 24 OsAAT genes were tandemly and segmentally duplicated, respectively. Comprehensive analyses were performed to investigate the expression profiles of OsAAT genes in various stages of vegetative and reproductive development by using data from EST, Microarrays, MPSS and Real-time PCR. Many OsAAT genes exhibited abundant and tissue-specific expression patterns. Moreover, 21 OsAAT genes were found to be differentially expressed under the treatments of abiotic stresses. Comparative analysis indicates that 26 AAT genes with close evolutionary relationships between rice and Arabidopsis exhibited similar expression patterns.

Conclusions/significance: This study will facilitate further studies on OsAAT family and provide useful clues for functional validation of OsAATs.


Conflict of interest statement

Competing Interests: The authors have declared that no competing interests exist.

Figures

Figure 1
Figure 1. Chromosomal localization and gene duplication events of OsAAT genes.
Respective chromosome numbers are indicated at the top of each bar. The scale on the left is in megabases (Mb). The cleavages on the chromosomes (vertical bars) indicate the position of centromeres. The chromosome order is arranged to bring duplicated regions in the vicinity.
Figure 2
Figure 2. Phylogenetic relationship and protein motifs of OsAATs.
(A) Phylogenetic tree of OsAATs constructed by neighbor-joining method. Bootstrap values from 1000 replicates are indicated at each node. Scale bar represents 0.2 amino acid substitution per site. The proteins on the tree can be divided into eleven distinct subfamilies. Subfamilies ATL are further divided into two groups (ATL a and ATL b). The branches of different subfamilies are marked by different colors. (B) Protein motifs of OsAATs. Each colored box represents a specific motif in the protein identified using the MEME motif search tool. The order of the motifs corresponds to their position within individual protein sequences.
Figure 3
Figure 3. Multiple sequence alignment and transmembrane region of OsAATs.
Identical (100%), conservative (75-99%) and block (50-74%) of similar amino acid residues are shaded in deep blue, cherry red and gray, respectively. The transmembrane regions are marked by blue lines. The conserved motifs 2, 6, 10, 4, 18 are orderly marked by red rectangles.
Figure 4
Figure 4. Expression profiles of OsAAT genes in various organs.
The microarray data sets (GSE6893) of OsAAT genes expression in organs at various developmental stages were reanalyzed. A heat map representing hierarchical cluster in various organs are generated. Color key represents average log2 expression values of OsAAT genes. Samples are indicated at the top of each lane: YR, roots from 7-day-old seedlings; ML, mature leaf; YL, leaves from 7-day-old seedling; SAM, shoot apical meristem; different stages of panicle development: P1, 0-3 cm; P2, 3-5 cm; P3, 5-10 cm; P4, 10-15 cm; P5, 15-22 cm; P6, 22-30 cm; different stages of seed development: S1, 0-2 dap (day after pollination); S2, 3-4 dap; S3, 5-10 dap; S4, 11-20 dap; S5, 21-29 dap. Genes that share similar expression patterns are divided into six groups (?-?). Asterisks (*), hash symbols (#), triangles (▴) and rounds (•) indicate the genes with preferential expression level in SAM, YR and/or ML/YL, P1-P6 and S1-S5, respectively. The representative OsAAT genes differentially expressed in various organs for which real-time PCR analysis was performed are indicated by a red diamond (?) on the right. The colour scale (representing average log signal values) is shown at the bottom.
Figure 5
Figure 5. Real-time PCR analysis of tissue-specific expression of the representative OsAAT genes.
Relative mRNA levels of individual genes normalized to UBQ5 are shown. Y-axis shows the relative mRNA expression level; X-axis shows different organs. (A), (B), (C) and (D) Showing the genes with preferential expression in St, L, P1 and P2, respectively. (E) Showing the genes with preferential expression in R, Sd, St and P1. Error bars indicate standard deviations of independent biological replicates (n  =  2 or more).
Figure 6
Figure 6. Differential expression profiles of OsAAT genes under abiotic stresses.
The microarray data sets (GSE6901) of gene expression under various abiotic stresses were used for cluster display. The average log signal values of OsAAT genes under control and various stress conditions (indicated at the top of each lane) are presented by a heat map. Only those genes that exhibited >2-fold or more differential expression, under any of the given abiotic stress conditions, are shown. The color scale representing average log signal values is shown at the bottom. The representative OsAAT genes differentially expressed under different abiotic stresses for which real-time PCR analysis was performed are indicated by black triangle at the right. The mRNA levels for each candidate gene in different samples were calculated relative to its expression in control seedlings. Error bars indicate standard deviations of independent biological replicates (n  =  3 or more). Two asterisks (**, P <0.01, Student’s t-test) represent significant differences between the controls and treatments. CK, control; DS, drought stress; SS, salt stress; CS, cold stress.
Figure 7
Figure 7. Expression comparison between rice and Arabidopsis AAT genes in different organs and under abiotic stresses.
The OsAAT and AtAAT genes are displayed according to the order in the corresponding phylogenetic tree (Figure S5). The expression data of OsAAT genes in different organs are combined from microarrays (M1) and MPSS (M2). In microarrays and MPSS data, red, green, yellow and light blue boxes indicate high (more than 2, 300 tpm), moderate (between 1 and 2, between 50 and 300 tpm), low (between 0.5 and 1, the signature numbers between 0 and 50 tpm), and extremely low (less than 0.5, no signature) expression levels, respectively. The symbol “×” represents no probe or signature on microarray and MPSS. “▴”, “▾” and “-” represent expression values that are evidently higher(>2), lower(<0.5) and no evident difference(0.5-2) under abiotic stresses compared to the control, respectively. (A) and (B-K) Showing homologous genes with distinct and similar expression patterns, respectively. R, root; L, leaf; I, inflorescence; P, pollen; S, silique (Arabidopsis) or seed (Rice); DSS and DSR; drought stressed shoot and root; SSS and SSR, salt stressed shoot and root; CSS and CSR, cold stressed shoot and root.
Figure 8
Figure 8. Expression divergence of paralogous OsAAT genes involved in duplication.
The absolute values of duplicated genes obtained from microarray data were compared in various organs under abiotic stresses. X-axis indicates representative samples and Y-axis is scales of expression level. The segmentally and tandemly duplicated genes are shown on the left and the right, respectively. (A) and (D) Showing gene pairs that are retention of expression; (B) and (E) showing gene pairs described as non-functionalization; (C) and (F) showing gene pairs described as neo-functionalization.

Similar articles

Cited by

References

    1. Tegeder M, Offler CE, Frommer WB, Patrick JW (2000) Amino acid transporters are localized to transfer cells of developing pea seeds. Plant Physiol 122: 319–326. - PMC - PubMed
    1. Wipf D, Ludewig U, Tegeder M, Rentsch D, Koch W, et al. (2002) Conservation of amino acid transporters in fungi, plants and animals. Trends Biochem Sci 27: 139–147. - PubMed
    1. Tegeder M (2012) Transporters for amino acids in plant cells: some functions and many unknowns. Curr Opin Plant Biol 15: 1–7. - PubMed
    1. Rentsch D, Schmidt S, Tegeder M (2007) Transporters for uptake and allocation of organic nitrogen compounds in plants. FEBS Lett 581: 2281–2289. - PubMed
    1. Saier MH, Yen MR, Noto K, Tamang DG, Elkan C (2009) The Transporter Classification Database: recent advances. Nucleic Acids Res 37: D274–D278. - PMC - PubMed

Publication types

MeSH terms

Substances