. 2012;7(11):e49290.
doi: 10.1371/journal.pone.0049290. Epub 2012 Nov 16.

Conformational changes of blood ACE in chronic uremia

Affiliations

Conformational changes of blood ACE in chronic uremia

Maxim N Petrov et al. PLoS One. 2012.

Abstract

Background: The pattern of binding of monoclonal antibodies (mAbs) to 16 epitopes on human angiotensin I-converting enzyme (ACE) comprise a conformational ACE fingerprint and is a sensitive marker of subtle protein conformational changes.

Hypothesis: Toxic substances in the blood of patients with uremia due to End Stage Renal Disease (ESRD) can induce local conformational changes in the ACE protein globule and alter the efficacy of ACE inhibitors.

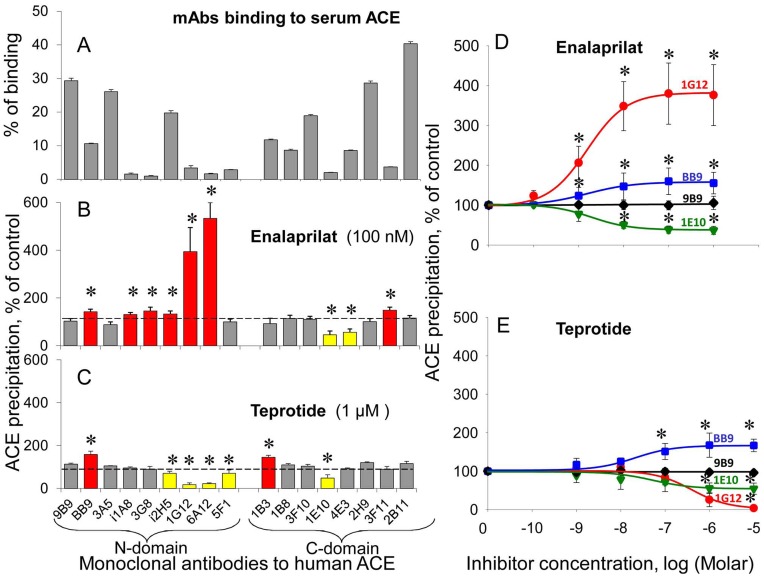
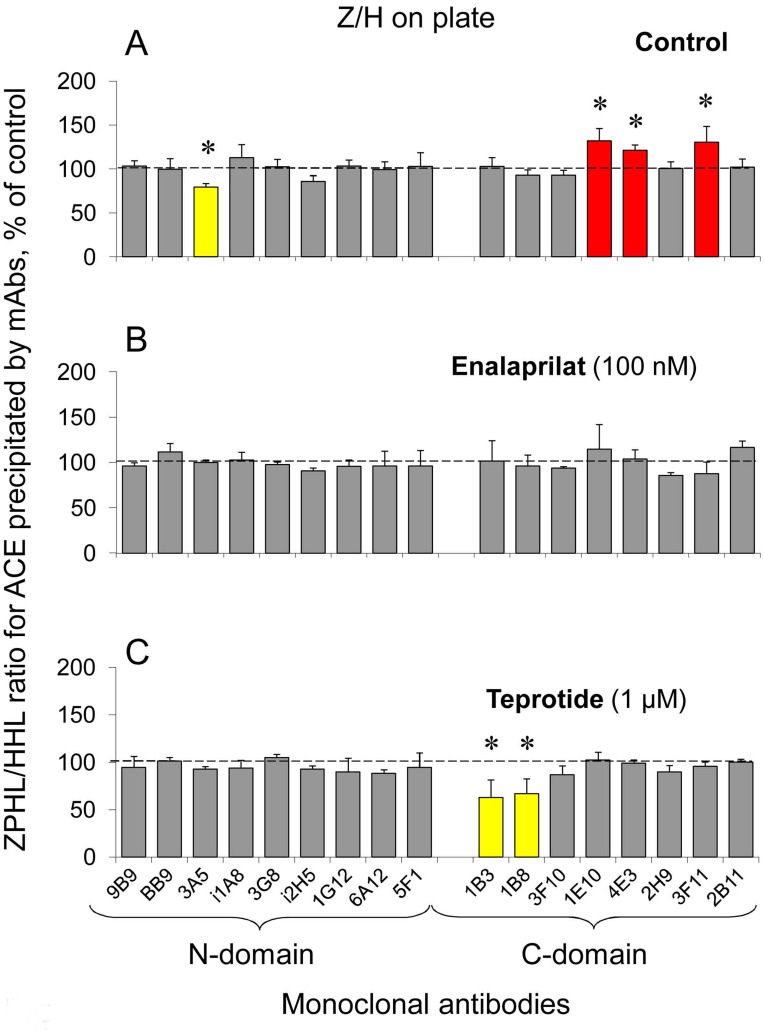
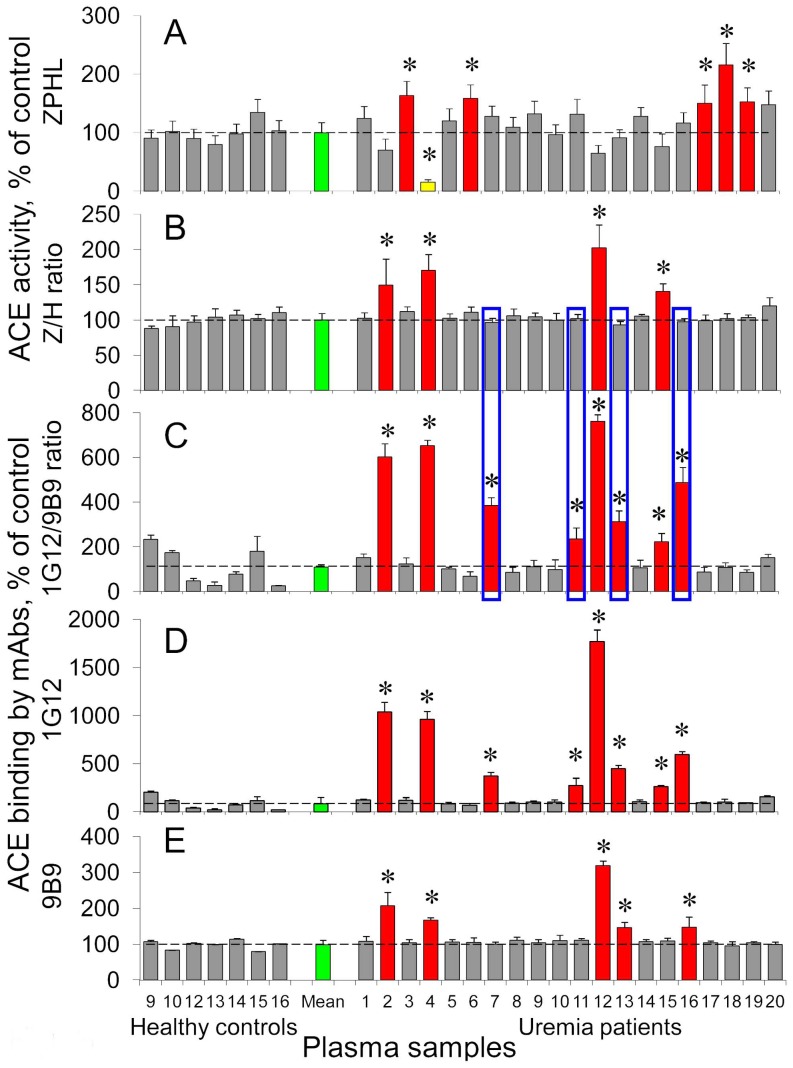
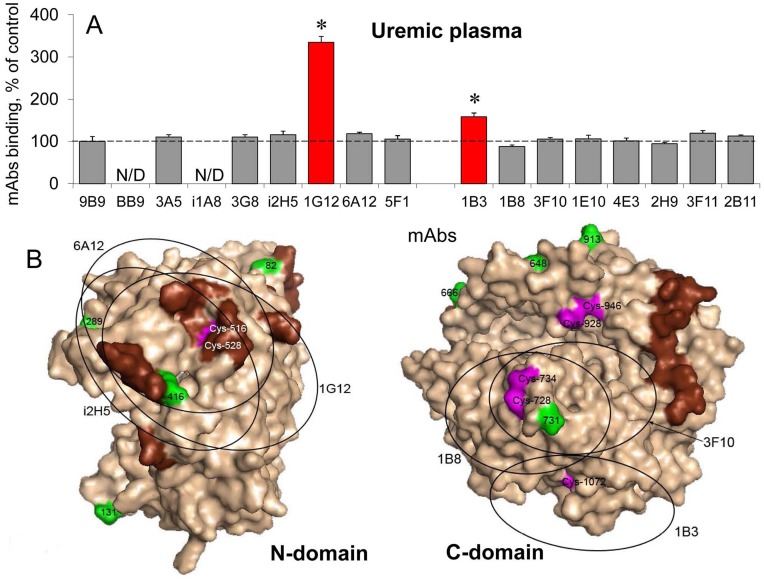
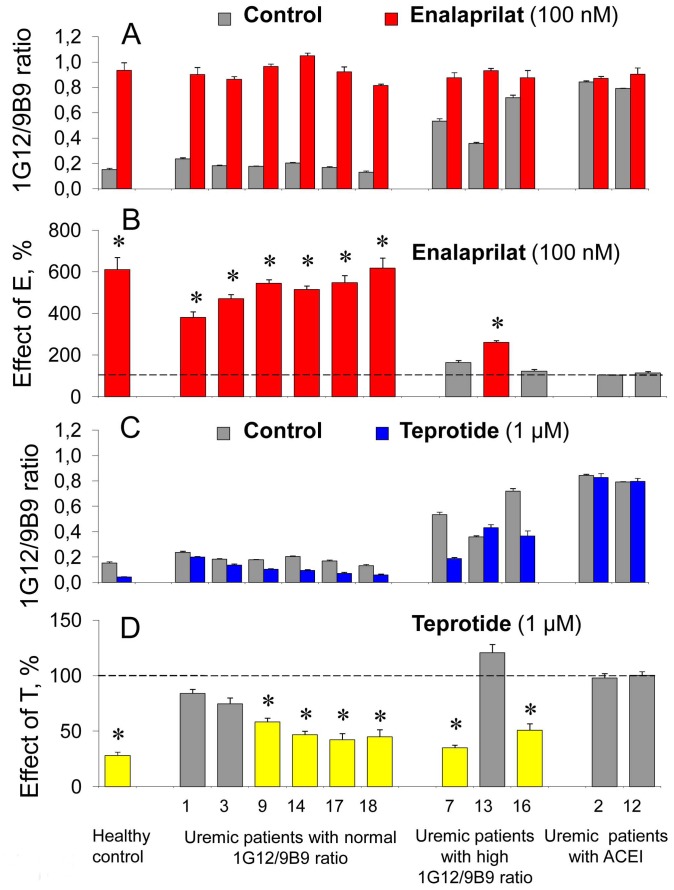
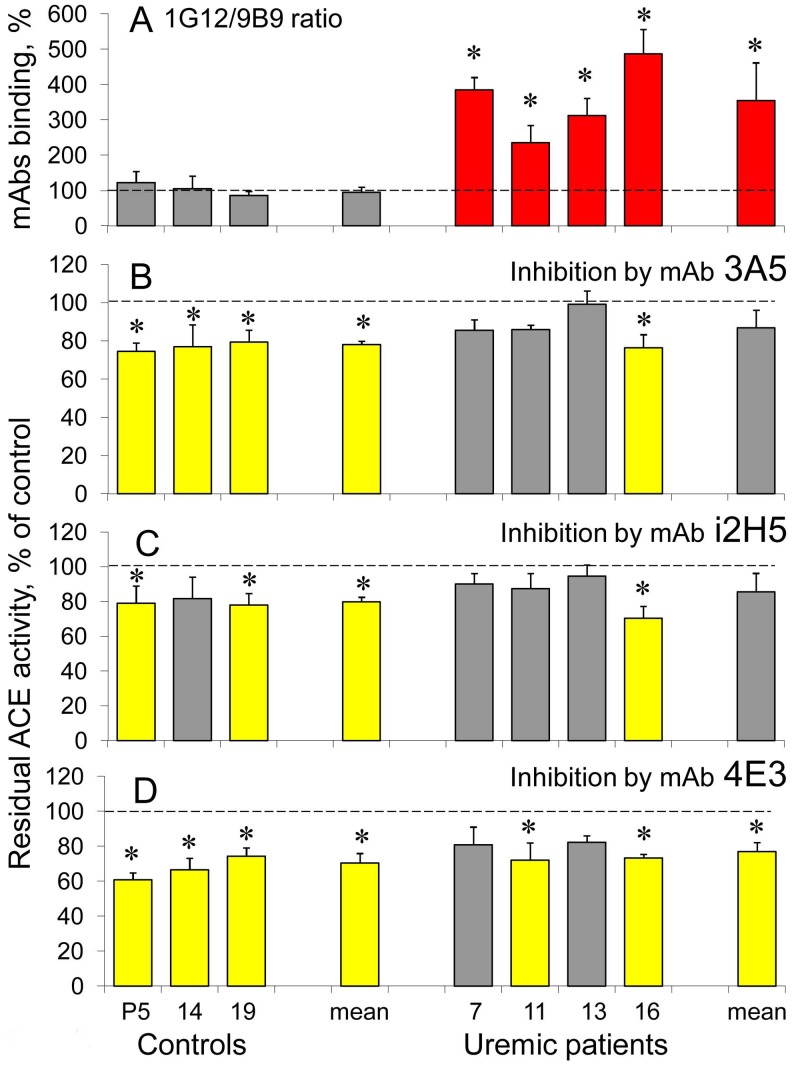
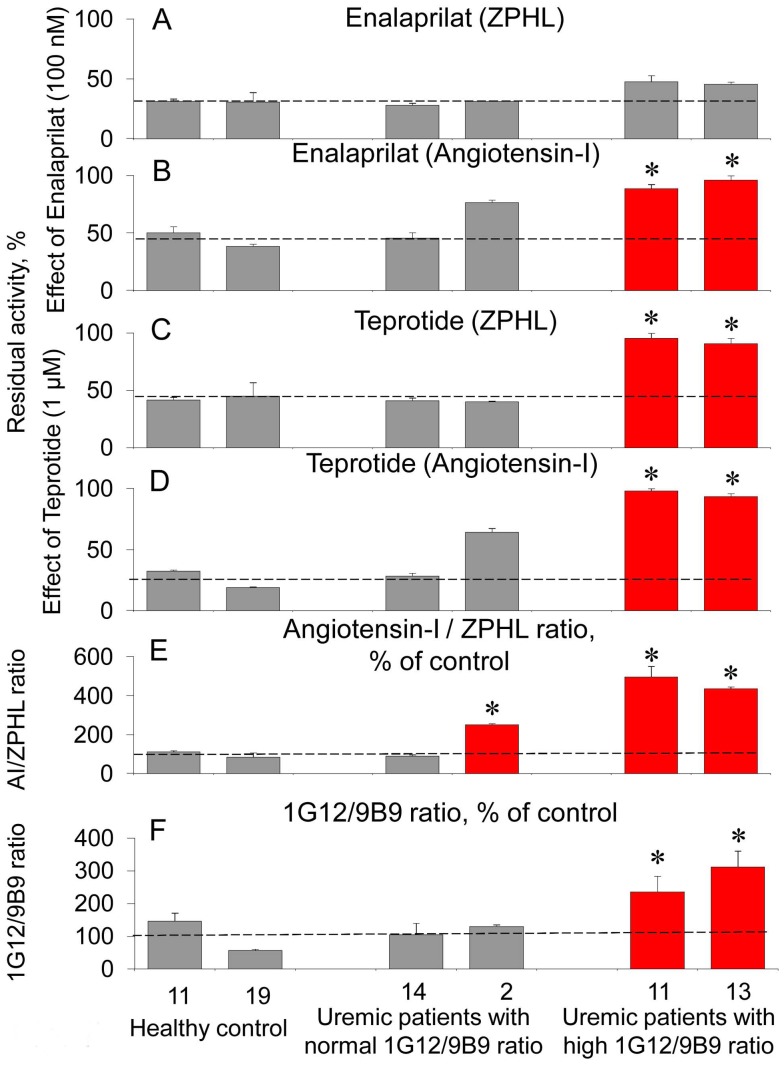
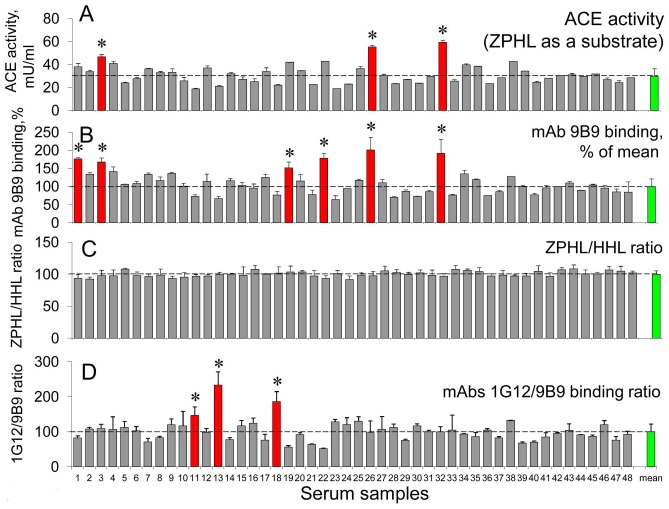
Methodology/principal findings: The recognition of ACE by 16 mAbs to the epitopes on the N and C domains of ACE was estimated using an immune-capture enzymatic plate precipitation assay. The precipitation pattern of blood ACE by a set of mAbs was substantially influenced by the presence of ACE inhibitors with the most dramatic local conformational change noted in the N-domain region recognized by mAb 1G12. The "short" ACE inhibitor enalaprilat (tripeptide analog) and "long" inhibitor teprotide (nonapeptide) produced strikingly different mAb 1G12 binding with enalaprilat strongly increasing mAb 1G12 binding and teprotide decreasing binding. Reduction in S-S bonds via glutathione and dithiothreitol treatment increased 1G12 binding to blood ACE in a manner comparable to enalaprilat. Some patients with uremia due to ESRD exhibited significantly increased mAb 1G12 binding to blood ACE and increased ACE activity towards angiotensin I accompanied by reduced ACE inhibition by inhibitory mAbs and ACE inhibitors.

Conclusions/significance: The estimation of relative mAb 1G12 binding to blood ACE detects a subpopulation of ESRD patients with conformationally changed ACE, which activity is less suppressible by ACE inhibitors. This parameter may potentially serve as a biomarker for those patients who may need higher concentrations of ACE inhibitors upon anti-hypertensive therapy.


Conflict of interest statement

Competing Interests: The authors have declared that no competing interests exist.

Figures

Figure 1
Figure 1. Effect of ACE inhibitors on the binding of a set of anti-ACE mAbs to blood ACE.
The binding of a set of 17 mAbs to the N and C domains of human sACE to the human serum ACE was determined using plate precipitation assay , with ZPHL as a substrate. Serum pooled from 30 healthy donors and diluted 1/5 in PBS (50 µl) was incubated with or without ACE inhibitors for 1 hour at 37oC and then was incubated overnight with microtiter plate coated with different anti-ACE mAbs (3 µg/ml) via goat-anti-mouse bridge. Serum components, inhibitors, as well as unbound ACE, were then eliminated by washing. ACE activity precipitated by each of tested mAbs was determined by adding ZPHL solution (in 100 mM potassium phosphate buffer, containing 300 mM KCl, 1 µM ZnSO4, pH 8.3) directly into the wells. After 1–4 hours at 37°C the product of the enzymatic reaction, His-Leu, was quantified by reaction with o-phthaldialdehyde spectrofluorometrically directly in the wells. A. Comparative binding of the mAbs set to serum ACE. B–C. Data are expressed as a percentage of precipitated ACE activity from serum pre-incubated with enalaprilat (100 nM - B) or teprotide (1 µM - C) by a given mAb from that w/o inhibitor. The colored columns show antibodies which binding to blood ACE in the presence of ACE inhibitor differed (more than 20%) from that to without the inhibitor: mAbs increasing or decreasing their binding to ACE in the presence of inhibitor are marked by red or yellow, respectively. D–E. Effect of different concentrations of enalaprilat (D) or teprotide (E) on mAbs binding to serum ACE. Data are mean ± SD of 3–8 independent experiments (each in duplicates). *, p<0.05 in comparison with mean values for samples without ACE inhibitors.
Figure 2
Figure 2. Effect of ACE inhibitors on the comparative rates of ZPHL and HHL hydrolysis by blood ACE bound by mAbs on the plate.
A. ACE activity precipitated from citrated pooled plasma by each given mAb was determined spectrofluorometrically directly in the wells (as in Fig. 1) with two substrates for ACE, HHL and ZPHL. Data are expressed as the ratio of the rates of the hydrolysis of two substrates (ZPHL/HHL ratio) by ACE bound by mAbs in comparison with the mean value obtained for all 17 mAbs. * - p<0.05 in comparison with mean value for the whole set of mAbs. B–C. Effect of enalaprilat (100 nM – B) and teprotide (1 µM – C) on ZPHL/HHL ratio determined for ACE bound with each mAb. * - p<0.05 in comparison with mean values for samples without ACE inhibitors. All other terms and conditions are as in Fig. 1. Red colored columns show those mAbs which binding with ACE increased (and yellow – decreased) ZPHL/HHL ratio. Data are mean ± SD from 3–8 independent experiments (each in duplicates). p<0.05 in comparison with mean values for samples without ACE inhibitors.
Figure 3
Figure 3. Blood ACE phenotyping in uremia.
A. ACE activity in the citrated plasma (diluted 5-fold) of patients with uremia (versus that of healthy volunteers) was determined spectrofluorometrically using 20 µl of diluted plasma with 100 µl of ACE substrate ZPHL at 1 hour of incubation with substrate. B. The ratio of the rates of the hydrolysis of two substrates (ZPHL/HHL ratio) for ACE from the blood of patients with uremia and from the blood of healthy persons. C-E. ACE activity precipitated by different mAbs from citrated plasma of uremic patients (versus that from plasma of healthy donors: E - by mAb 9B9; D - by mAb 1G12 and C – their ratio for each plasma sample. Results are shown as mean ± SD from 3 to 10 independent experiments, each in duplicates or triplicates. The red color of the columns shows plasma of those patients whose blood parameter (ACE activity, Z/H ratio, 1G12/9B9 ratio/mAb 9B9 or 1G12 binding) was significantly higher (and yellow bar-significantly lower) than mean value for healthy donors. The green bars shows mean values for healthy controls. Boxes show those patients which have increased 1G12/9B9 ratio while normal ZPHL/HHL ratio. All other terms and conditions are as in Fig. 1. * - p<0.05 in comparison with mean value for healthy controls.
Figure 4
Figure 4. Conformational fingerprinting of uremic plasma with highly elevated 1G12/9B9 ratio and normal Z/H ratio.
A. ACE activity precipitated by different mAbs from plasma of uremic patients with highly elevated 1G12/9B9 ratio and normal Z/H ratio (mean data for uremic samples #7 and #16 from Fig. 3) as a percentage from that for plasma from uremic persons with normal 1G12/9B9 and ZPHL/HHL ratios (mean data of two uremic samples #5 and #18 from Fig. 3) taken as control. Data presented are mean ± SD of duplicates from 2 experiments. The red-colored columns show those antibodies which binding to blood ACE in uremic patients with high 1G12/9B9 ratio differ more than 20% from that for patients with normal 1G12/9B9 ratio. * – parameter from the test sample was statistically different (p<0.05) from the healthy control. B. Localization of disulfide bridges and free cysteine residues in the epitopes for mAbs 1G12 together with overlapping epitopes for mAbs 6A12 and i2H5 on the N domain of ACE (left) and mAb 1B3 together with adjacent epitopes for mAbs 1B8 and 3F10 (on the C domain of ACE ). The regions of the epitopes for different mAbs were marked by circles with diameter of approximately 30Å, which corresponds to the square of 600–900 Å2. Cysteine residues are marked magenta; potential glycosylation sites are marked green; amino acid residues participating in hinge-bending movement of domains are marked brown.
Figure 5
Figure 5. Effect of ACE inhibitors on the local conformation of blood ACE in uremia.
A. The ratio of ACE activities precipitated from the citrated plasma of uremic patients by mAbs 1G12 and 9B9 (1G12/9B9 ratio) and from pooled plasma from healthy volunteers in the presence of enalaprilat (100 nM) – red bars and without the inhibitor – grey bars. B. The data presented on Fig. 5A were also expressed as a percentage of the effect of enalaprilat on the values of 1G12/9B9 ratio for different patients. The red columns show those mAbs for which enalaprilat effect (increase of mAb binding) exceeded 20%. C. The ratio of ACE activities precipitated from the citrated plasma of uremic patients by mAbs 1G12 and 9B9 (1G12/9B9 ratio) and from pooled plasma from healthy volunteers in the presence of teprotide (1 µM) – blue bars and without the inhibitor – grey bars. D. The data presented on Fig. 5C were also expressed as a percentage of the effect of teprotide on the values of 1G12/9B9 ratio for different patients. The yellow columns show those mAbs for which teprotide effect (decrease of mAb binding) exceeded 20%. All other terms and conditions – as in Figure 1. Data are mean ± SD of 3 independent experiments (each in duplicates). *, p<0.05 in comparison with mean value obtained without inhibitor.
Figure 6
Figure 6. Effect of anti-catalytic mAbs on plasma ACE in uremia.
A. The ratio of ACE activities precipitated from the citrated plasma of uremic patients with high 1G12/9B9 ratio and normal ZPHL/HHL ratio and from healthy controls (P5– pooled citrated plasma, #14 and #19– individual plasmas) by mAbs 1G12 and 9B9 (1G12/9B9 ratio. Grey bars – healthy controls; red bars – uremic patients with high 1G12/9B9 ratio with p<0.05 in comparison with mean value. B-D. Effect of anti-catalytic mAbs on ACE activity. The effects of anti-N domain mAbs 3A5 and i2H5 were determined with ZPHL as a substrate. The effect of anti-C domain mAb 4E3 was determined with HHL as a substrate. Data are presented as a residual ACE activity after incubation of tested mAbs (10 µg/ml) with citrated plasma (diluted 5-fold). Grey bars – ACE inhibition less than 20%, yellow bars – more than 20% of ACE inhibition. Data are mean ± SD of 3 independent experiments (each in duplicates), with p<0.05 in comparison with mean value obtained without anti-catalytic mAb.
Figure 7
Figure 7. Effect of ACE inhibitors on the activity of plasma ACE in uremia.
AD Citrated plasma samples of uremic patients with normal (patients #14 and #2) and high (patients #11 and #13) 1G12/9B9 ratio (versus healthy controls, #11 and #19) were incubated with “short” ACE inhibitor enalaprilat (100 nM, A and B) and “long” ACE inhibitor teprotide (1 µM, C and D) for 1 hour. Data are presented as a residual ACE activity determined with “short” substrate ZPHL (0.5 mM, A and C) and “long” substrate angiotensin I (0.3 mM, B and D). Data are presented as a residual ACE activity. E. The ratio of the rates of the hydrolysis of angiotensin I and ZPHL (angiotensin I/ZPHL ratio) for corresponding samples. F. mAb1G12/9B9 binding ratio for corresponding samples expressed as % from the mean value for healthy persons. Grey bars – inhibition of ACE activity (A–D) or parameters measured in E–F in uremic samples was not differed from that for healthy patients with low 1G12/9B9 ratio. Red bars –measured parameters were statistically higher than that in healthy patients with low (normal) 1G12/9B9 ratio *, p<0.05 in comparison with mean value for healthy patients. Data are mean ± SD from 3 independent experiments (each in duplicates).
Figure 8
Figure 8. Blood ACE phenotyping in healthy donors.
A. ACE activity in serum of healthy young donors was determined as in Figure 3. B. ACE activity precipitated from serum of healthy donors by mAb 9B9 (estimation of relative ACE protein content). C. The ratio of the rates of the hydrolysis of two substrates (ZPHL/HHL ratio) for tested serum samples was determined as in Figure 3 . D. ACE activity precipitated from serum of healthy donors by mAbs 9B9 and 1G12 and expressed as their ratio for each serum sample. The red color of the bar shows serum of those patients whose tested parameters were significantly higher (and yellow bar – significantly lower) than mean value for all samples (green bars). Results are shown as mean ±SD of 4 independent experiments, each in duplicates or triplicates. *, statistically significant difference (p<0.05) from the mean value.
Figure 9
Figure 9. Blood pressure in patients with uremia due to ESRD.
Blood pressure was measured in patients with ESRD before dialysis and before blood sampling. According to T test p values for the differences in Systolic Blood Pressure (SBP) and Diastolic Blood Pressure (DBP) between patients with conformationally naïve and conformationally changed ACE were close to the level of significance (p<0.05).

Similar articles

Cited by

References

    1. Ehlers MWR, Riordan JF (1989) Angiotensin-converting enzyme: new concepts concerning its biological role. Biochemistry 8: 5311–5318. - PubMed
    1. Bernstein KE, Xiao HD, Frenzel K, Li P, Shen XZ, et al. (2005) Six truisms concerning ACE and the renin-angiotensin system educed from the genetic analysis of mice. Circ Res 96: 1135–1144. - PubMed
    1. Sturrock ED, Anthony CS, Danilov SM (2012) Peptidyl-dipeptidase A/Angiotensin I-converting enzyme. In: Editors-in-Chief: Neil D. Rawlings, Guy Salvesen, Handbook of Proteolytic Enzymes, 3rd Edition, Academic Press, Oxford (in press).
    1. Caldwell PR, Seegal BC, Hsu KC, Das H, Soffer RL (1976) Angiotensin-converting enzyme: vascular endothelial localization. Science 191: 1050–1051. - PubMed
    1. Ryan US, Ryan JW, Whitaker C, Chiu A (1976) Localization of angiotensin converting enzyme (kininase II). II. Immunocytochemistry and immunofluorescence. Tissue Cell 8: 124–145. - PubMed

Publication types

MeSH terms