

Exon 1 disruption alters tissue-specific expression of mouse p53 and results in selective development of B cell lymphomas
- PMID: 23166633
- PMCID: PMC3498120
- DOI: 10.1371/journal.pone.0049305
Exon 1 disruption alters tissue-specific expression of mouse p53 and results in selective development of B cell lymphomas
Abstract
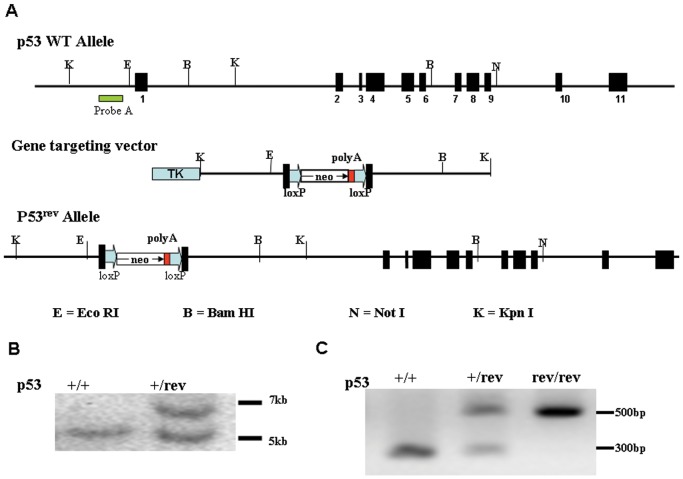
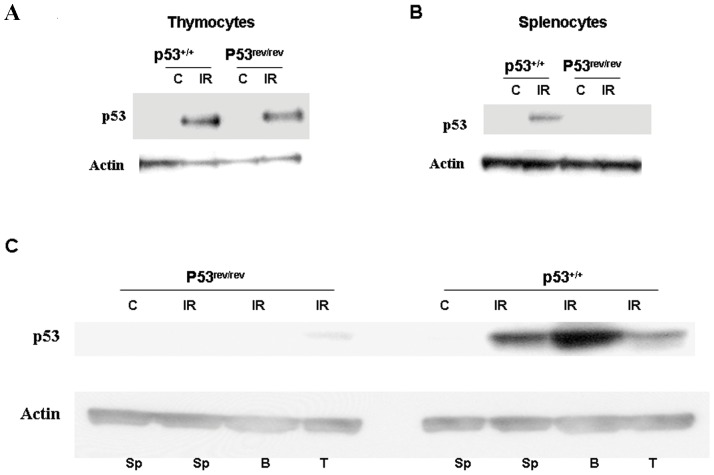
p53 is a tumor suppressor gene mutated in >50% of human cancers, while p53 deficiency in mice results in cancers and accelerated mortality. Thymic T cell lymphoma is the most common malignancy in p53-deficient mice, making it difficult to study the role of p53 in other malignancies. To overcome this limitation, we attempted to generate mice with a reversible p53 knockout (p53(rev/rev)) by inserting a floxed transcriptional stop into the first exon of p53, anticipating that this would allow tissue-specific Cre-mediated expression of p53. Contrary to expectations, functional p53 protein was expressed in the thymus and multiple other tissues of p53(rev/rev) mice in the absence of Cre, whereas B cells expressed p53 protein only in the presence of B cell-specific CD19-Cre. In the absence of Cre, 76% of p53(rev/rev) mice developed splenic marginal zone B cell lymphomas, indicating sensitivity of this B cell subset to transformation caused by p53 deficiency. 5'-RACE identified p53 mRNA transcribed from a novel start site utilized in thymocytes but not normal B cells or B cell lymphomas from p53(rev/rev) mice. The p53(rev/rev) mouse thus demonstrates an effect of p53 deficiency in development of splenic marginal zone lymphomas and provides a model for study of p53-deficient human B cell lymphomas.
Conflict of interest statement
Figures


Similar articles
-
Conditional inactivation of p53 in mature B cells promotes generation of nongerminal center-derived B-cell lymphomas.Proc Natl Acad Sci U S A. 2013 Feb 19;110(8):2934-9. doi: 10.1073/pnas.1222570110. Epub 2013 Feb 4. Proc Natl Acad Sci U S A. 2013. PMID: 23382223 Free PMC article.
-
Splenic marginal zone B-cell and thymic T-cell lymphomas in p53-deficient mice.Lab Invest. 1999 Jan;79(1):3-14. Lab Invest. 1999. PMID: 9952106
-
A non-transgenic mouse model for B-cell lymphoma: in vivo infection of p53-null bone marrow progenitors by a Myc retrovirus is sufficient for tumorigenesis.Oncogene. 2002 Mar 14;21(12):1922-7. doi: 10.1038/sj.onc.1205244. Oncogene. 2002. PMID: 11896625
-
Inactivation of p53 is insufficient to allow B cells and B-cell lymphomas to survive without Dicer.Cancer Res. 2014 Jul 15;74(14):3923-34. doi: 10.1158/0008-5472.CAN-13-1866. Epub 2014 May 19. Cancer Res. 2014. PMID: 24840646 Free PMC article.
-
Mutant mice lacking alternatively spliced p53 isoforms unveil Ackr4 as a male-specific prognostic factor in Myc-driven B-cell lymphomas.Elife. 2024 Sep 19;13:RP92774. doi: 10.7554/eLife.92774. Elife. 2024. PMID: 39298333 Free PMC article.
Cited by
-
Efficient generation of P53 biallelic knockout Diannan miniature pigs via TALENs and somatic cell nuclear transfer.J Transl Med. 2017 Nov 3;15(1):224. doi: 10.1186/s12967-017-1327-0. J Transl Med. 2017. PMID: 29100547 Free PMC article.
-
Length and secondary structure of the 5' non-coding regions of mouse p53 mRNA transcripts - mouse as a model organism for p53 gene expression studies.RNA Biol. 2019 Jan;16(1):25-41. doi: 10.1080/15476286.2018.1556084. Epub 2018 Dec 20. RNA Biol. 2019. PMID: 30518296 Free PMC article.
-
Distinct oncogenic phenotypes in hematopoietic specific deletions of Trp53.Sci Rep. 2023 May 9;13(1):7490. doi: 10.1038/s41598-023-33949-8. Sci Rep. 2023. PMID: 37160922 Free PMC article.
-
NIAM-deficient mice are predisposed to the development of proliferative lesions including B-cell lymphomas.PLoS One. 2014 Nov 13;9(11):e112126. doi: 10.1371/journal.pone.0112126. eCollection 2014. PLoS One. 2014. PMID: 25393878 Free PMC article.
-
Systematic target function annotation of human transcription factors.BMC Biol. 2018 Jan 10;16(1):4. doi: 10.1186/s12915-017-0469-0. BMC Biol. 2018. PMID: 29325558 Free PMC article.
References
-
- Feng Z, Hu W, Rajagopal G, Levine AJ (2008) The tumor suppressor p53: cancer and aging. Cell Cycle 7: 842–847. - PubMed
-
- Hussain SP, Harris CC (2006) p53 biological network: at the crossroads of the cellular-stress response pathway and molecular carcinogenesis. J Nippon Med Sch 73: 54–64. - PubMed
-
- Sengupta S, Harris CC (2005) p53: traffic cop at the crossroads of DNA repair and recombination. Nat Rev Mol Cell Biol 6: 44–55. - PubMed
Publication types
MeSH terms
Substances
Grants and funding
LinkOut - more resources
Full Text Sources
Molecular Biology Databases
Research Materials
Miscellaneous
