

Individual differences in detecting rapidly presented fearful faces
- PMID: 23166693
- PMCID: PMC3498139
- DOI: 10.1371/journal.pone.0049517
Individual differences in detecting rapidly presented fearful faces
Abstract
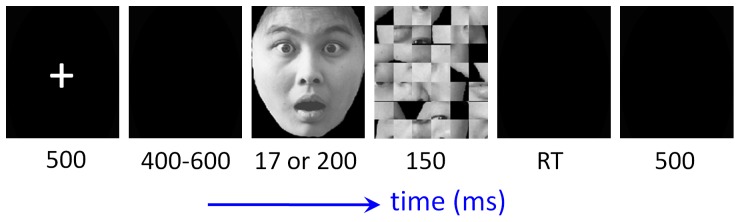
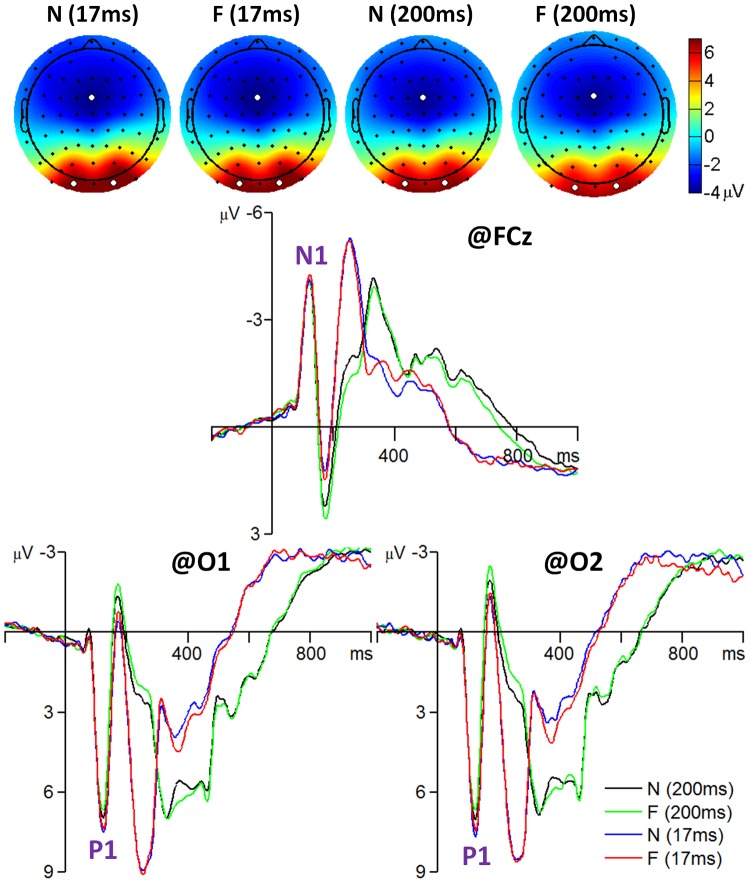
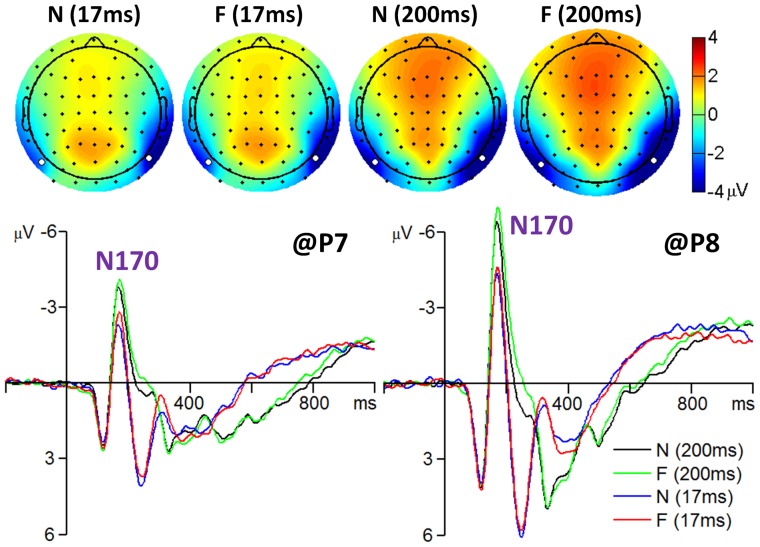
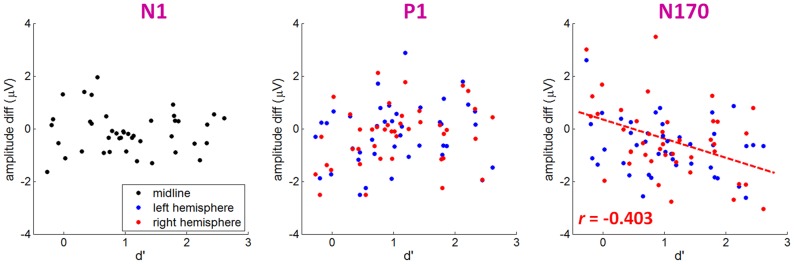
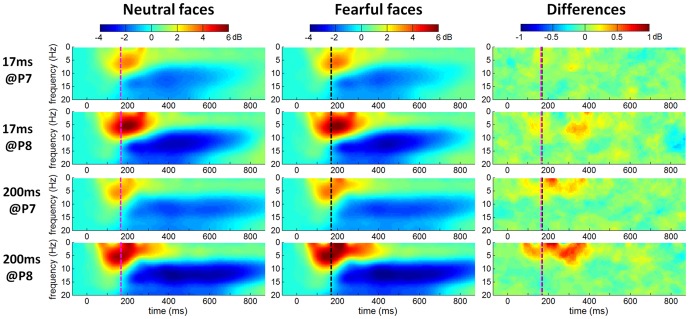
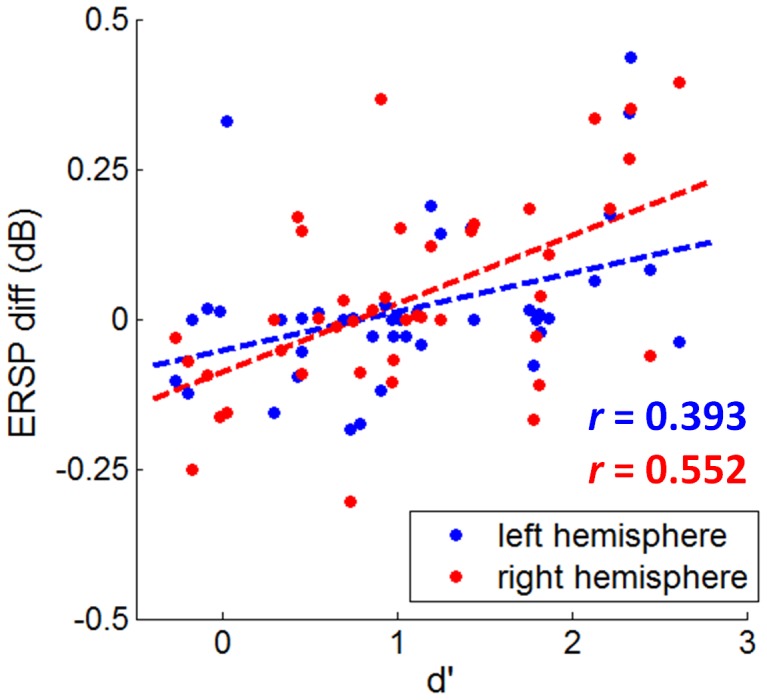
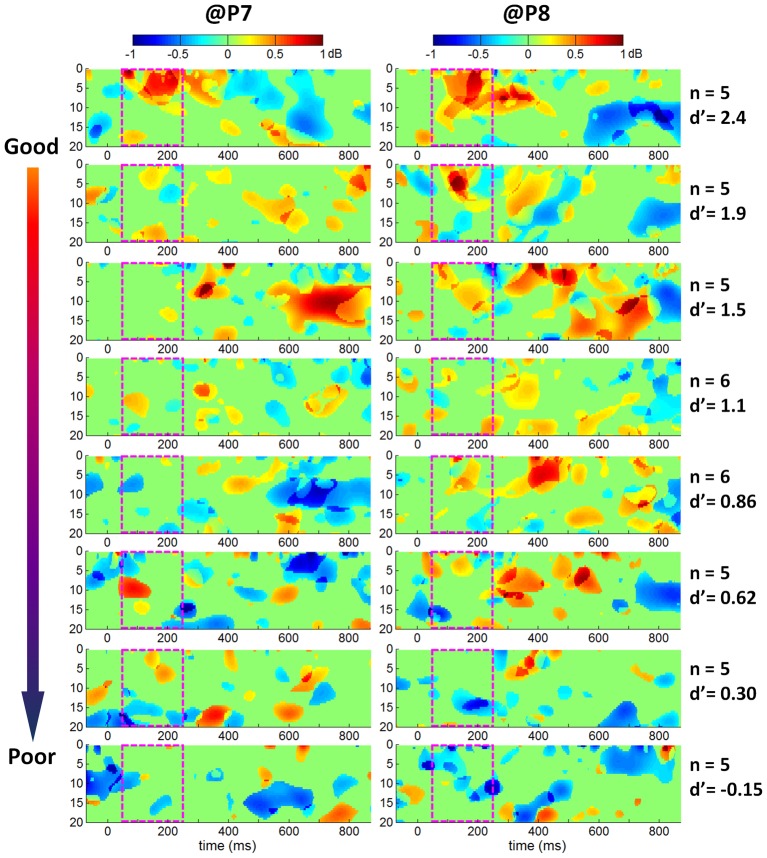
Rapid detection of evolutionarily relevant threats (e.g., fearful faces) is important for human survival. The ability to rapidly detect fearful faces exhibits high variability across individuals. The present study aimed to investigate the relationship between behavioral detection ability and brain activity, using both event-related potential (ERP) and event-related oscillation (ERO) measurements. Faces with fearful or neutral facial expressions were presented for 17 ms or 200 ms in a backward masking paradigm. Forty-two participants were required to discriminate facial expressions of the masked faces. The behavioral sensitivity index d' showed that the detection ability to rapidly presented and masked fearful faces varied across participants. The ANOVA analyses showed that the facial expression, hemisphere, and presentation duration affected the grand-mean ERP (N1, P1, and N170) and ERO (below 20 Hz and lasted from 100 ms to 250 ms post-stimulus, mainly in theta band) brain activity. More importantly, the overall detection ability of 42 subjects was significantly correlated with the emotion effect (i.e., fearful vs. neutral) on ERP (r = 0.403) and ERO (r = 0.552) measurements. A higher d' value was corresponding to a larger size of the emotional effect (i.e., fearful--neutral) of N170 amplitude and a larger size of the emotional effect of the specific ERO spectral power at the right hemisphere. The present results suggested a close link between behavioral detection ability and the N170 amplitude as well as the ERO spectral power below 20 Hz in individuals. The emotional effect size between fearful and neutral faces in brain activity may reflect the level of conscious awareness of fearful faces.
Conflict of interest statement
Figures
Similar articles
-
The spatial frequency spectrum of fearful faces modulates early and mid-latency ERPs but not the N170.Psychophysiology. 2020 Sep;57(9):e13597. doi: 10.1111/psyp.13597. Epub 2020 May 10. Psychophysiology. 2020. PMID: 32390215
-
Gender differences in subliminal affective face priming: A high-density ERP study.Brain Behav. 2021 Apr;11(4):e02060. doi: 10.1002/brb3.2060. Epub 2021 Feb 2. Brain Behav. 2021. PMID: 33528111 Free PMC article.
-
Is processing superiority a universal trait for all threats? Divergent impacts of fearful, angry, and disgusted faces on attentional capture.Cortex. 2024 Aug;177:37-52. doi: 10.1016/j.cortex.2024.05.005. Epub 2024 May 28. Cortex. 2024. PMID: 38833819
-
Links between rapid ERP responses to fearful faces and conscious awareness.J Neuropsychol. 2008 Mar;2(Pt 1):165-81. doi: 10.1348/174866407X245411. J Neuropsychol. 2008. PMID: 19330049 Free PMC article.
-
Distributed and interactive brain mechanisms during emotion face perception: evidence from functional neuroimaging.Neuropsychologia. 2007 Jan 7;45(1):174-94. doi: 10.1016/j.neuropsychologia.2006.06.003. Epub 2006 Jul 18. Neuropsychologia. 2007. PMID: 16854439 Review.
Cited by
-
Theta- and Gamma-Band Activity Discriminates Face, Body and Object Perception.Front Hum Neurosci. 2020 Mar 12;14:74. doi: 10.3389/fnhum.2020.00074. eCollection 2020. Front Hum Neurosci. 2020. PMID: 32226369 Free PMC article.
-
Oscillatory brain dynamics underlying affective face processing.Soc Cogn Affect Neurosci. 2025 May 21;20(1):nsaf047. doi: 10.1093/scan/nsaf047. Soc Cogn Affect Neurosci. 2025. PMID: 40324903 Free PMC article.
-
EEG Functional Connectivity Underlying Emotional Valance and Arousal Using Minimum Spanning Trees.Front Neurosci. 2020 May 7;14:355. doi: 10.3389/fnins.2020.00355. eCollection 2020. Front Neurosci. 2020. PMID: 32457566 Free PMC article.
-
The Functional Role of Neural Oscillations in Non-Verbal Emotional Communication.Front Hum Neurosci. 2016 May 25;10:239. doi: 10.3389/fnhum.2016.00239. eCollection 2016. Front Hum Neurosci. 2016. PMID: 27252638 Free PMC article. Review.
-
Comparing Neural Correlates of Human Emotions across Multiple Stimulus Presentation Paradigms.Brain Sci. 2021 May 25;11(6):696. doi: 10.3390/brainsci11060696. Brain Sci. 2021. PMID: 34070554 Free PMC article.
References
-
- Tamietto M, de Gelder B (2010) Neural bases of the non-conscious perception of emotional signals. Nature Reviews Neuroscience 11: 697–709. - PubMed
-
- Pessoa L (2005) To what extent are emotional visual stimuli processed without attention and awareness? Current Opinion in Neurobiology 15: 188–196. - PubMed
-
- Palermo R, Rhodes G (2007) Are you always on my mind? A review of how face perception and attention interact. Neuropsychologia 45: 75–92. - PubMed
-
- Eimer M, Holmes A (2002) An ERP study on the time course of emotional face processing. Neuroreport 13: 427–431. - PubMed
Publication types
MeSH terms
Grants and funding
LinkOut - more resources
Full Text Sources
