. 2012;7(11):e49521.
doi: 10.1371/journal.pone.0049521. Epub 2012 Nov 16.

Macroevolutionary dynamics and historical biogeography of primate diversification inferred from a species supermatrix

Affiliations

Macroevolutionary dynamics and historical biogeography of primate diversification inferred from a species supermatrix

Mark S Springer et al. PLoS One. 2012.

Abstract

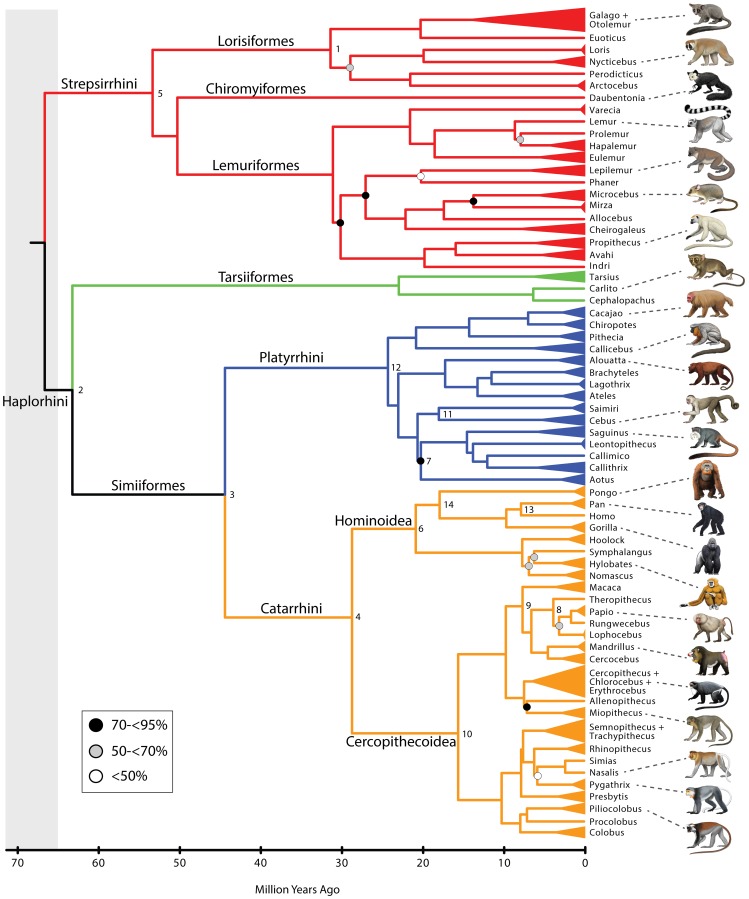
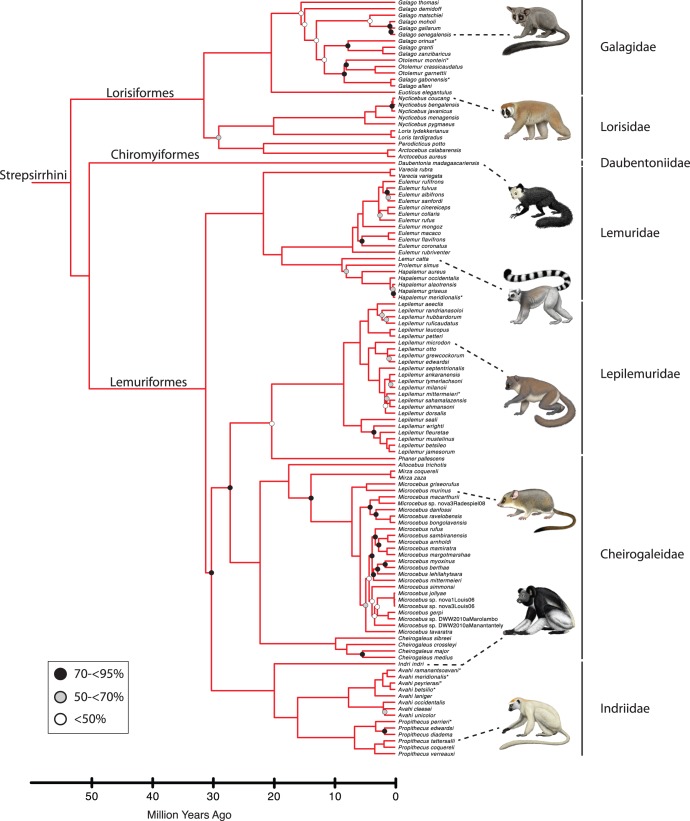
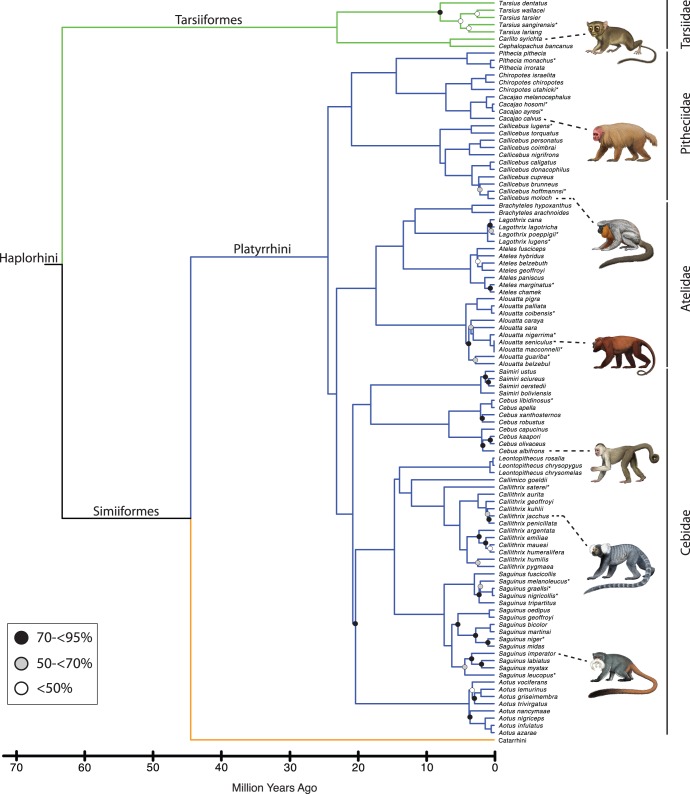
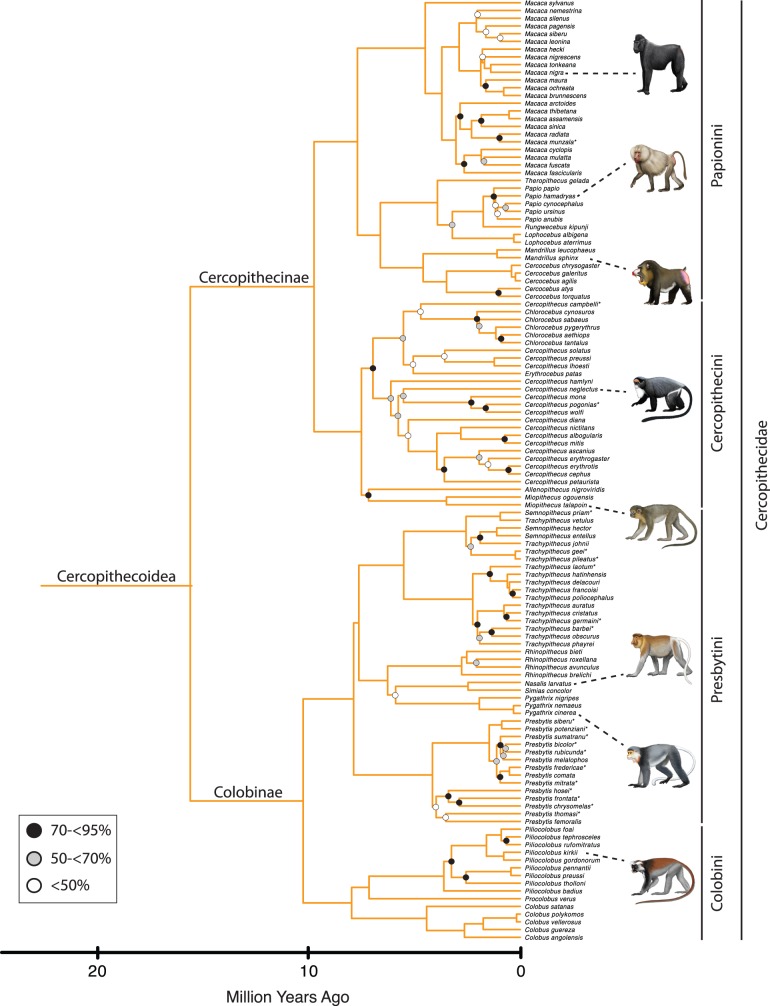
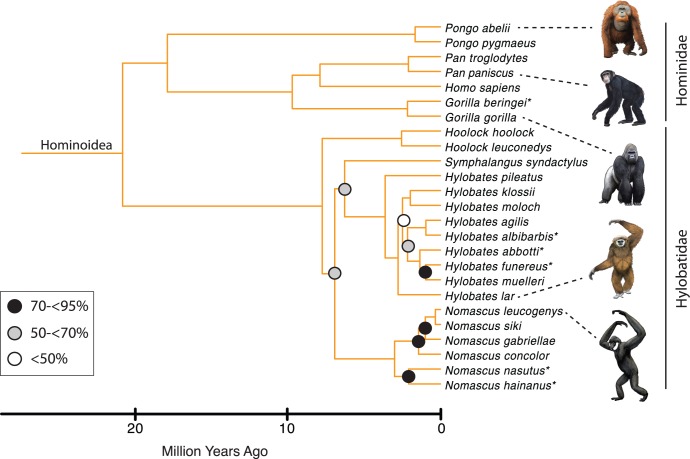
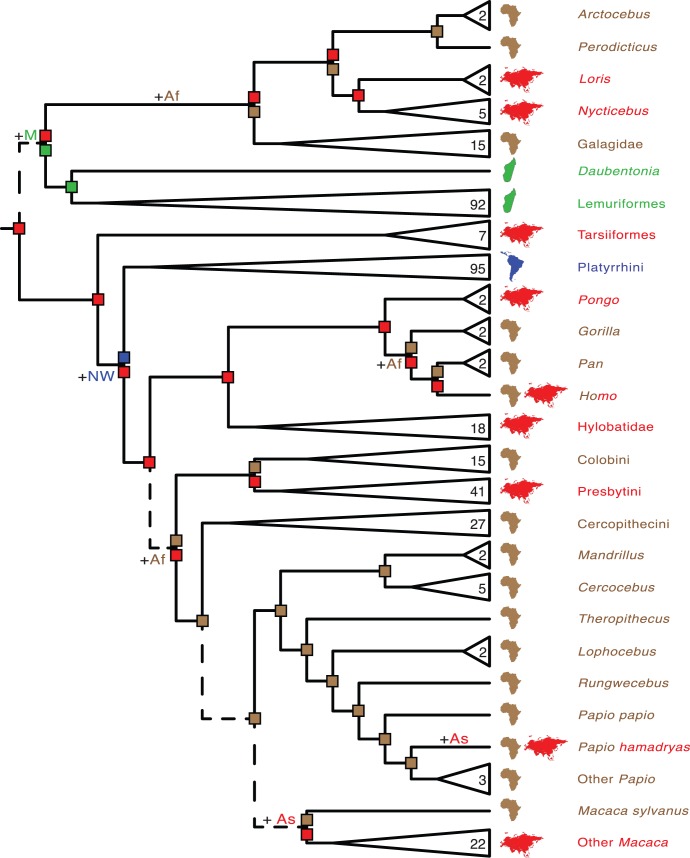
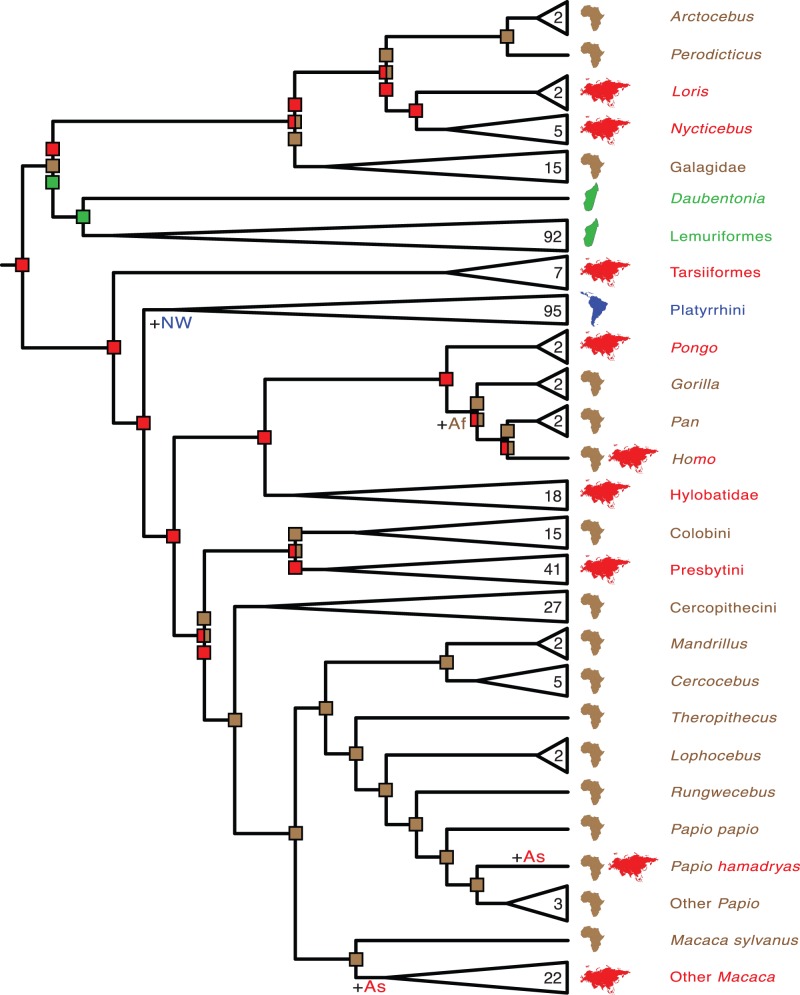
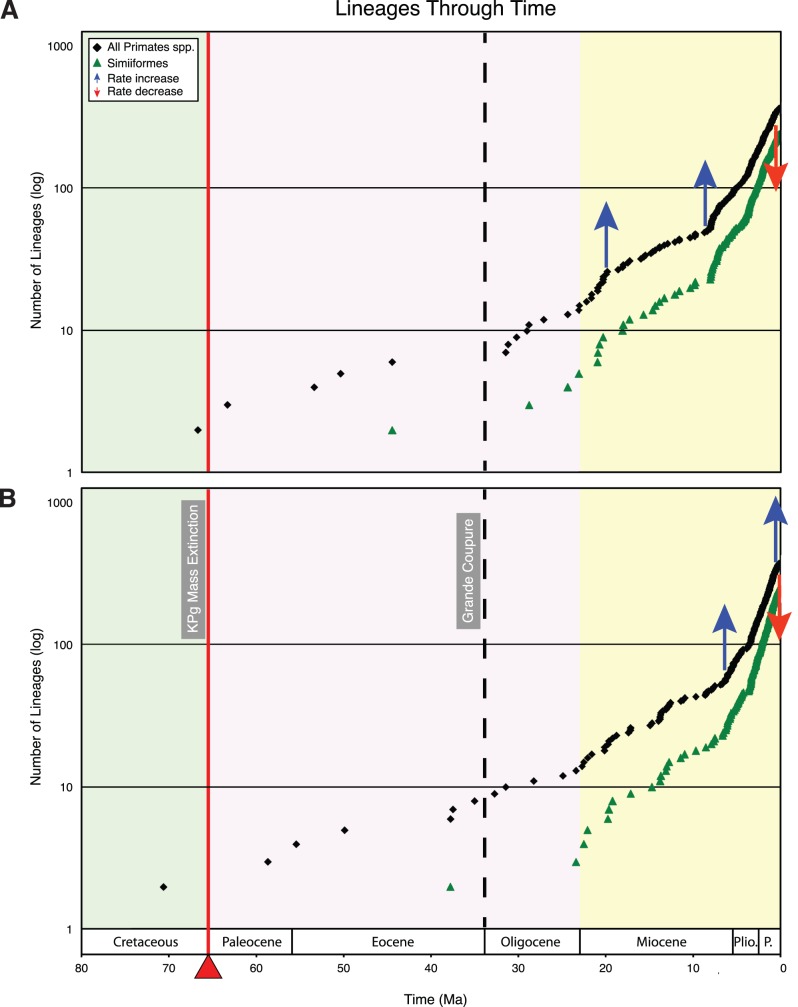
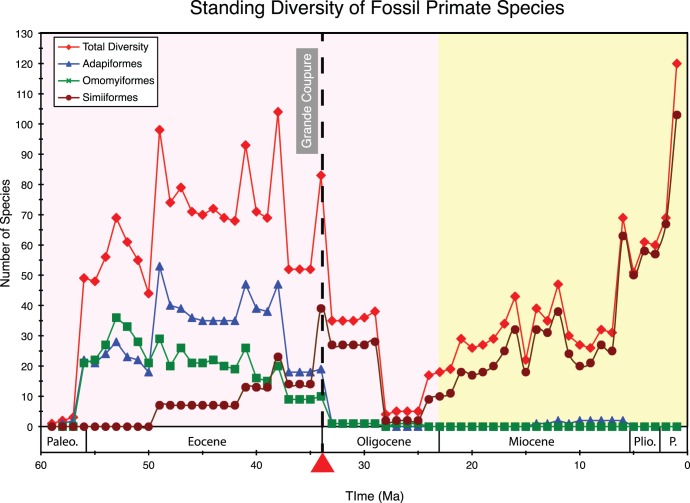
Phylogenetic relationships, divergence times, and patterns of biogeographic descent among primate species are both complex and contentious. Here, we generate a robust molecular phylogeny for 70 primate genera and 367 primate species based on a concatenation of 69 nuclear gene segments and ten mitochondrial gene sequences, most of which were extracted from GenBank. Relaxed clock analyses of divergence times with 14 fossil-calibrated nodes suggest that living Primates last shared a common ancestor 71-63 Ma, and that divergences within both Strepsirrhini and Haplorhini are entirely post-Cretaceous. These results are consistent with the hypothesis that the Cretaceous-Paleogene mass extinction of non-avian dinosaurs played an important role in the diversification of placental mammals. Previous queries into primate historical biogeography have suggested Africa, Asia, Europe, or North America as the ancestral area of crown primates, but were based on methods that were coopted from phylogeny reconstruction. By contrast, we analyzed our molecular phylogeny with two methods that were developed explicitly for ancestral area reconstruction, and find support for the hypothesis that the most recent common ancestor of living Primates resided in Asia. Analyses of primate macroevolutionary dynamics provide support for a diversification rate increase in the late Miocene, possibly in response to elevated global mean temperatures, and are consistent with the fossil record. By contrast, diversification analyses failed to detect evidence for rate-shift changes near the Eocene-Oligocene boundary even though the fossil record provides clear evidence for a major turnover event ("Grande Coupure") at this time. Our results highlight the power and limitations of inferring diversification dynamics from molecular phylogenies, as well as the sensitivity of diversification analyses to different species concepts.


Conflict of interest statement

Competing Interests: The authors have declared that no competing interests exist.

Figures

Figure 1
Figure 1. A timetree for 70 primate genera based on mcmctree with autocorrelated rates and soft-bounded constraints.
The tree was rooted with five outgroups from Lagomorpha, Scandentia, and Dermoptera (not shown). All nodes without filled circles were recovered with≥95% bootstrap support in maximum likelihood analyses with RAxML. Black, gray, and white filled circles indicate nodes that were recovered with 70 to<95% bootstrap support, 50 to<70% bootstrap support, and<50% bootstrap support, respectively. The full timetree with 367 primate species and five outgroups is provided in Text S2. Also see Figure 2 (strepsirrhines), Figure 3 (tarsiiforms+platyrrhines), Figure 4 (cercopithecoid), and Figure 5 (hominoids). Calibrated nodes are indicated with numbers and are cross-referenced to Text S3. Paintings by Carl Buell.
Figure 2
Figure 2. Strepsirrhine portion of mcmctree timetree (autocorrelated rates, soft-bounded constraints).
Nodes without filled circles and nodes with black, gray, and white filled circles are as in Figure 1. Primate species that were represented by a single locus in the RAxML analysis with the combined (nuclear+mitochondrial) data set are denoted with asterisks. Paintings by Carl Buell.
Figure 3
Figure 3. Tarsiiform and platyrrhine portion of mcmctree timetree (autocorrelated rates, soft-bounded constraints).
Nodes without filled circles and nodes with black, gray, and white filled circles are as in Figure 1. Primate species that were represented by a single locus in the RAxML analysis with the combined (nuclear+mitochondrial) data set are denoted with asterisks. Paintings by Carl Buell.
Figure 4
Figure 4. Cercopithecoid portion of mcmctree timetree (autocorrelated rates, soft-bounded constraints).
Nodes without filled circles and nodes with black, gray, and white filled circles are as in Figure 1. Primate species that were represented by a single locus in the RAxML analysis with the combined (nuclear+mitochondrial) data set are denoted with asterisks. Paintings by Carl Buell.
Figure 5
Figure 5. Hominoid portion of mcmctree timetree (autocorrelated rates, soft-bounded constraints).
Nodes without filled circles and nodes with black, gray, and white filled circles are as in Figure 1. Primate species that were represented by a single locus in the RAxML analysis with the combined (nuclear+mitochondrial) data set are denoted with asterisks. Paintings by Carl Buell.
Figure 6
Figure 6. Ancestral area reconstructions for extant primates based on dispersal-extinction-cladogenesis (DEC).
Ancestral area reconstructions were performed under a simplified DEC model that allowed a maximum of two areas at internal nodes. Internal nodes with a single square were reconstructed to include a single area, whereas internal nodes with two squares were reconstructed to include two areas. Dashed lines between adjacent nodes indicate that alternative area reconstructions at the basal-most node fall within two log-likelihood units of the optimal scenario shown in the figure. Multi-colored names denote taxa that occur in more than one area. Range transitions on branches indicate inferred dispersal events. Numbers in triangles indicate the number of species in each collapsed clade.
Figure 7
Figure 7. Ancestral area reconstructions for extant primates based on minimum area change (MAC) parsimony.
Nodes with unambiguous ancestral area reconstructions are shown with a single colored square; nodes with ambiguous reconstructions are shown with two or more squares, and each colored square corresponds to a different reconstruction. Bi-colored squares indicate reconstructions that included two areas. Multi-colored names denote taxa that occur in more than one area. Range transitions on branches indicate inferred dispersal events. Numbers in triangles indicate the number of species in each collapsed clade.
Figure 8
Figure 8. Lineage through time (LTT) plots for Primates and Simiiformes based on Groves05+taxon sampling.
(A) LTT plot based on timetree with autocorrelated rates and soft-bounded constraints. (B) LTT plot based on timetree with independent rates and hard-bounded constraints. Arrows denote statistically significant rate increases and decreases that were detected with TreePar (see Table 3). Green background = Cretaceous; pink background = Paleogene; yellow background = Neogene.
Figure 9
Figure 9. Standing diversity of fossil primate species throughout the Cenozoic.
Total primate diversity includes all crown primate fossils found within the Paleobiology Database and Hartwig . Adapiformes and Omomyiformes are extinct lineages. The position of the Grande Coupure at ∼ 33.9 Ma is indicated by a dashed black line. Pink background = Paleogene; yellow background = Neogene.

References

    1. Bloch JI, Silcox MT, Boyer DM, Sargis EJ (2007) New Paleocene skeletons and the relationship of plesiadapiforms to crown-clade primates. Proc Natl Acad Sci U S A 104: 1159–1164. - PMC - PubMed
    1. Silcox MT (2008) The biogeographic origins of Primates and Euprimates: east, west, north, or south of Eden? In: Sargis EJ, Dagosto M, eds. Mammalian evolutionary morphology: a tribute to Frederick S. Szalay. Dordrecht, The Netherlands: Springer. pp 199–231.
    1. Fabre PH, Rodrigues A, Douzery EJP (2009) Patterns of macroevolution among Primates inferred from a supermatrix of mitochondrial and nuclear DNA. Mol Phylogenet Evol 53: 808–825. - PubMed
    1. Groves CP (1993) Order Primates. In: Wilson DE, Reeder DM, eds. Mammal species of the world: a taxonomic and geographic reference, second edition. Washington and London: Smithsonian Institution Press. pp 243–277.
    1. Groves CP (2001) Primate taxonomy. Washington, DC: Smithsonian Institution Press. 350 p.

Publication types

Substances