

Aristolochia manshuriensis Kom inhibits adipocyte differentiation by regulation of ERK1/2 and Akt pathway
- PMID: 23166699
- PMCID: PMC3498119
- DOI: 10.1371/journal.pone.0049530
Aristolochia manshuriensis Kom inhibits adipocyte differentiation by regulation of ERK1/2 and Akt pathway
Abstract
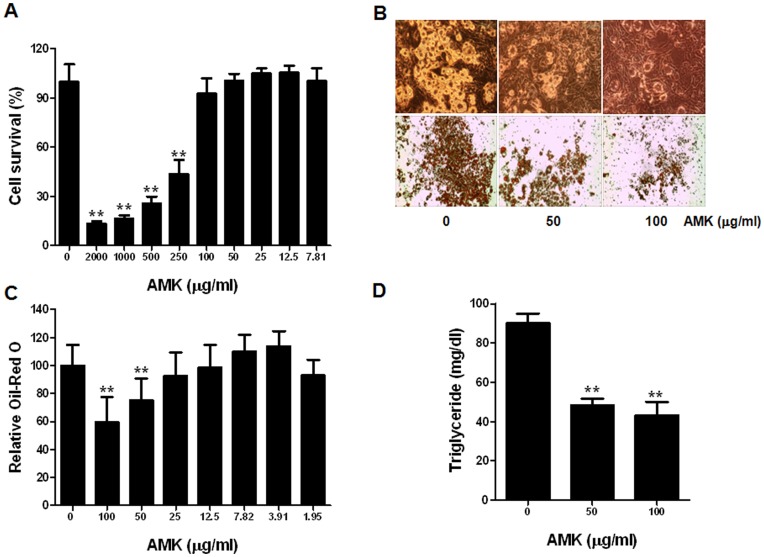
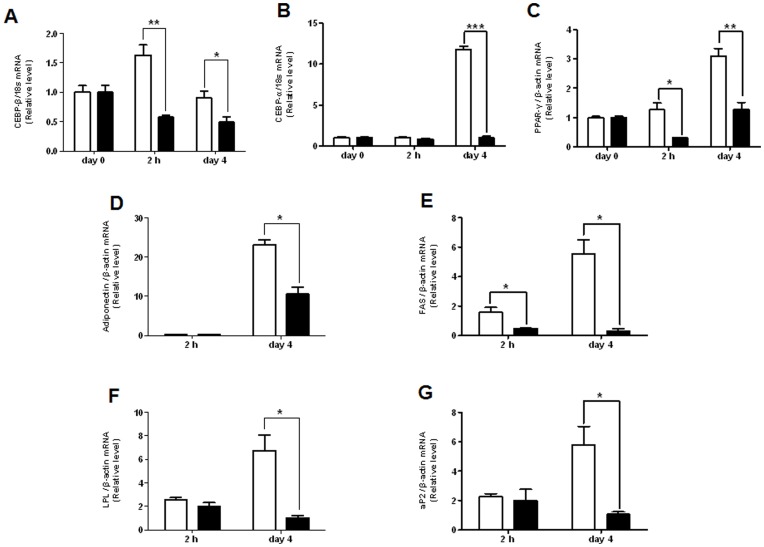
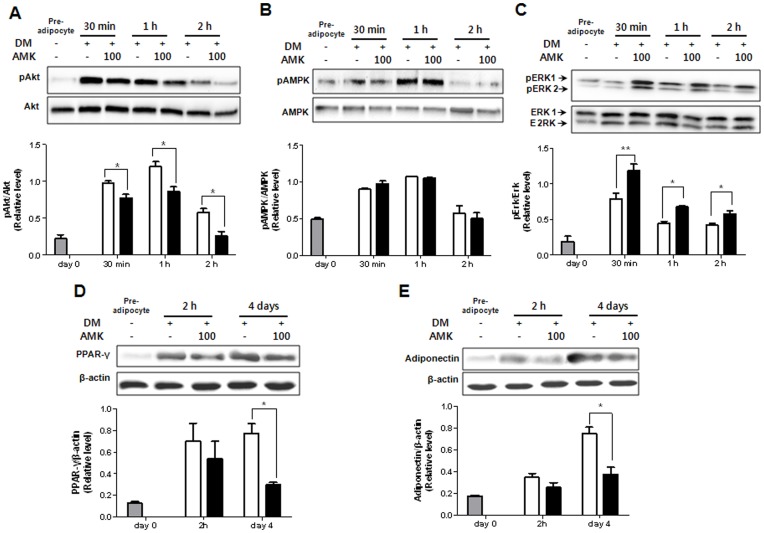
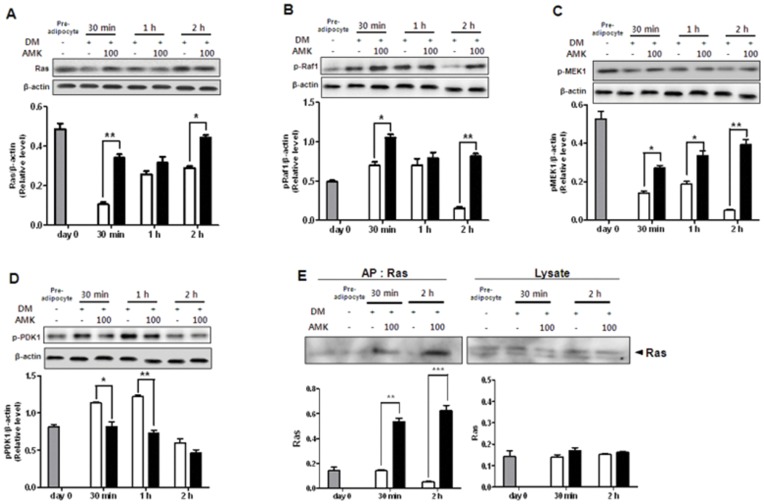
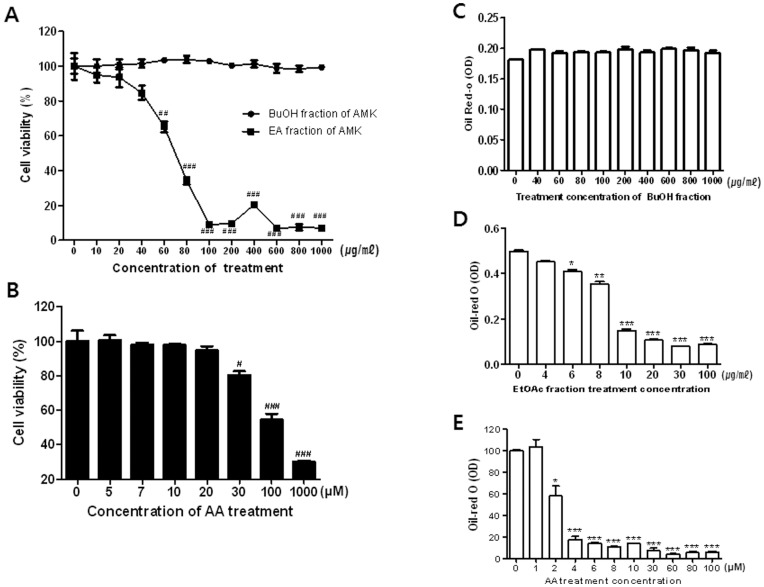
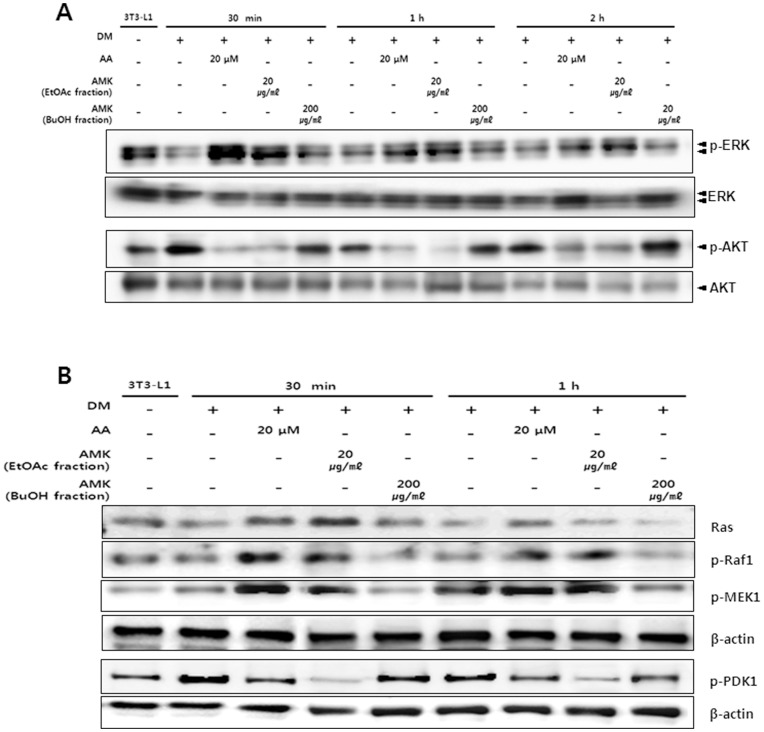
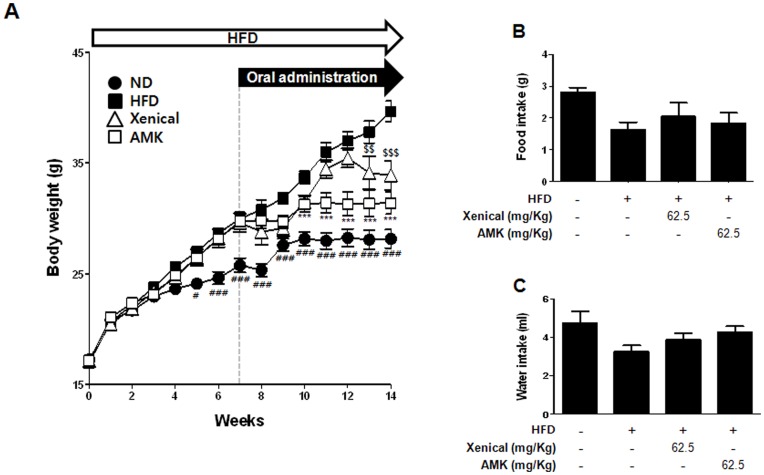
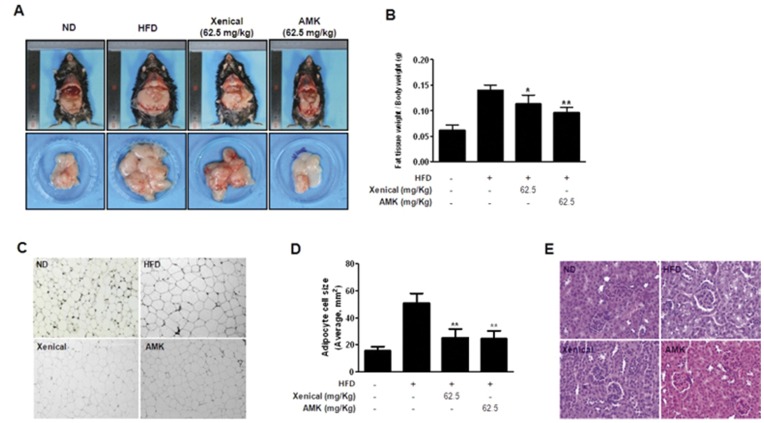
Aristolochia manshuriensis Kom (AMK) is a traditional medicinal herb used for the treatment of arthritis, rheumatism, hepatitis, and anti-obesity. Because of nephrotoxicity and carcinogenicity of AMK, there are no pharmacological reports on anti-obesity potential of AMK. Here, we showed AMK has an inhibitory effect on adipocyte differentiation of 3T3-L1 cells along with significantly decrease in the lipid accumulation by downregulating several adipocyte-specific transcription factors including peroxisome proliferation-activity receptor γ (PPAR-γ), CCAAT/enhancer binding protein α (C/EBP-α) and C/EBP-β, which are critical for adipogenesis in vitro. AMK also markedly activated the extracellular signal-regulated protein kinase 1/2 (ERK1/2) pathway including Ras, Raf1, and mitogen-activated protein kinase kinase 1 (MEK1), and significantly suppressed Akt pathway by inhibition of phosphoinositide-dependent kinase 1 (PDK1). Aristolochic acid (AA) and ethyl acetate (EtOAc) fraction of AMK with AA were significantly inhibited TG accumulation, and regulated two pathway (ERK1/2 and Akt) during adipocyte differentiation, and was not due to its cytotoxicity. These two pathways were upstream of PPAR-γ and C/EBPα in the adipogenesis. In addition, gene expressions of secreting factors such as fatty acid synthase (FAS), adiponectin, lipopreotein lipase (LPL), and aP2 were significantly inhibited by treatment of AMK during adipogenesis. We used the high-fat diet (HFD)-induced obesity mouse model to determine the inhibitory effects of AMK on obesity. Oral administration of AMK (62.5 mg/kg/day) significantly decreased the fat tissue weight, total cholesterol (TC), and low density lipoprotein-cholesterol (LDL-C) concentration in the blood. The results of this study suggested that AMK inhibited lipid accumulation by the down-regulation of the major transcription factors of the adipogensis pathway including PPAR-γ and C/EBP-α through regulation of Akt pathway and ERK 1/2 pathway in 3T3-L1 adipocytes and HFD-induced obesity mice, and AA may be main act in inhibitory effects of AMK during adipocyte differentiation.
Conflict of interest statement
Figures
Similar articles
-
Coprinus comatus cap inhibits adipocyte differentiation via regulation of PPARγ and Akt signaling pathway.PLoS One. 2014 Sep 2;9(9):e105809. doi: 10.1371/journal.pone.0105809. eCollection 2014. PLoS One. 2014. PMID: 25181477 Free PMC article.
-
Zanthoxylum schinifolium leaf ethanol extract inhibits adipocyte differentiation through inactivation of the extracellular signal regulated kinase and phosphoinositide 3-kinase/Akt signaling pathways in 3T3-L1 pre-adipocytes.Mol Med Rep. 2015 Jul;12(1):1314-20. doi: 10.3892/mmr.2015.3463. Epub 2015 Mar 10. Mol Med Rep. 2015. PMID: 25760758
-
Blueberry peel extracts inhibit adipogenesis in 3T3-L1 cells and reduce high-fat diet-induced obesity.PLoS One. 2013 Jul 25;8(7):e69925. doi: 10.1371/journal.pone.0069925. Print 2013. PLoS One. 2013. PMID: 23936120 Free PMC article.
-
Novel insights of dietary polyphenols and obesity.J Nutr Biochem. 2014 Jan;25(1):1-18. doi: 10.1016/j.jnutbio.2013.09.001. J Nutr Biochem. 2014. PMID: 24314860 Free PMC article. Review.
-
MicroRNAs as Epigenetic Regulators of Obesity.Adv Exp Med Biol. 2024;1460:595-627. doi: 10.1007/978-3-031-63657-8_20. Adv Exp Med Biol. 2024. PMID: 39287866 Review.
Cited by
-
Prediction and Characterisation of the System Effects of Aristolochic Acid: A Novel Joint Network Analysis towards Therapeutic and Toxicological Mechanisms.Sci Rep. 2015 Dec 1;5:17646. doi: 10.1038/srep17646. Sci Rep. 2015. PMID: 26620132 Free PMC article.
-
Aristolochia manshuriensis Kom ethyl acetate extract protects against high-fat diet-induced non-alcoholic steatohepatitis by regulating kinase phosphorylation in mouse.J Vet Sci. 2016 Sep 30;17(3):279-87. doi: 10.4142/jvs.2016.17.3.279. J Vet Sci. 2016. PMID: 26726030 Free PMC article.
-
Corni Fructus Containing Formulation Attenuates Weight Gain in Mice with Diet-Induced Obesity and Regulates Adipogenesis through AMPK.Evid Based Complement Alternat Med. 2013;2013:423741. doi: 10.1155/2013/423741. Epub 2013 Sep 19. Evid Based Complement Alternat Med. 2013. PMID: 24171041 Free PMC article.
-
Chrysophanic Acid Suppresses Adipogenesis and Induces Thermogenesis by Activating AMP-Activated Protein Kinase Alpha In vivo and In vitro.Front Pharmacol. 2016 Dec 8;7:476. doi: 10.3389/fphar.2016.00476. eCollection 2016. Front Pharmacol. 2016. PMID: 28008317 Free PMC article.
-
Plant natural products as an anti-lipid droplets accumulation agent.J Nat Med. 2014 Apr;68(2):253-66. doi: 10.1007/s11418-014-0822-3. Epub 2014 Feb 19. J Nat Med. 2014. PMID: 24550097 Free PMC article. Review.
References
-
- Duvnjak L, Duvnjak M (2009) The metabolic syndrome - an ongoing story. J Physiol Pharmacol Suppl 7: 19–24. - PubMed
-
- Abate N (2000) Obesity and cardiovascular disease. Pathogenetic role of the metabolic syndrome and therapeutic implications. J Diabetes Complications 14: 154–174. - PubMed
-
- Unger RH, Zhou YT (2001) Lipotoxicity of beta-cells in obesity and in other causes of fatty acid spillover. Diabetes 50 Suppl 1S118–121. - PubMed
-
- Farmer SR, Auwerx J (2004) Adipose tissue: new therapeutic targets from molecular and genetic studies–IASO Stock Conference 2003 report. Obes Rev 5: 189–196. - PubMed
-
- Fu J, Oveisi F, Gaetani S, Lin E, Piomelli D (2005) Oleoylethanolamide, an endogenous PPAR-alpha agonist, lowers body weight and hyperlipidemia in obese rats. Neuropharmacology 48: 1147–1153. - PubMed
Publication types
MeSH terms
Substances
LinkOut - more resources
Full Text Sources
Research Materials
Miscellaneous
