. 2012;7(11):e49569.
doi: 10.1371/journal.pone.0049569. Epub 2012 Nov 14.

Transcriptome analysis of renal ischemia/reperfusion injury and its modulation by ischemic pre-conditioning or hemin treatment

Affiliations

Transcriptome analysis of renal ischemia/reperfusion injury and its modulation by ischemic pre-conditioning or hemin treatment

Matheus Correa-Costa et al. PLoS One. 2012.

Abstract

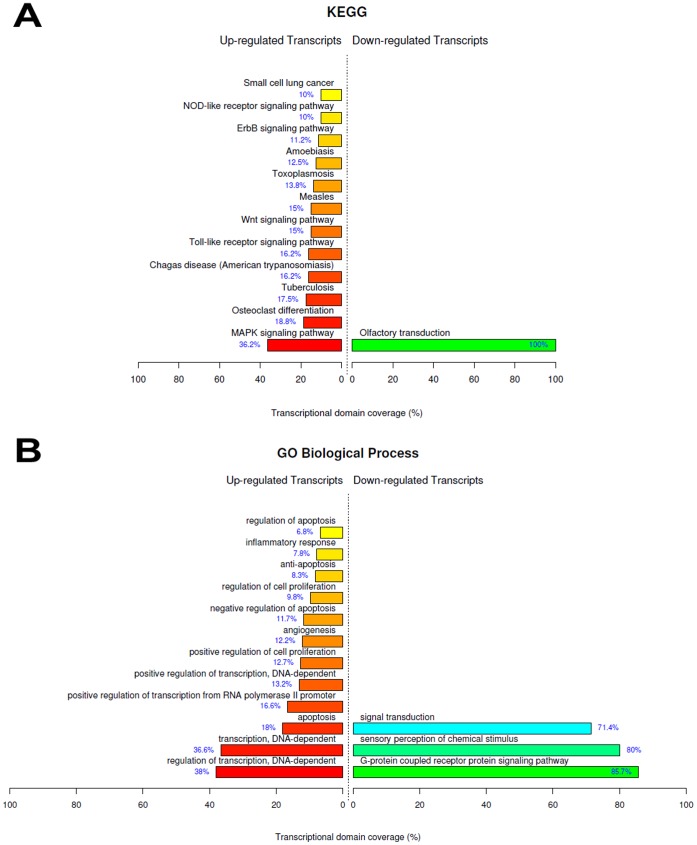
Ischemia/reperfusion injury (IRI) is a leading cause of acute renal failure. The definition of the molecular mechanisms involved in renal IRI and counter protection promoted by ischemic pre-conditioning (IPC) or Hemin treatment is an important milestone that needs to be accomplished in this research area. We examined, through an oligonucleotide microarray protocol, the renal differential transcriptome profiles of mice submitted to IRI, IPC and Hemin treatment. After identifying the profiles of differentially expressed genes observed for each comparison, we carried out functional enrichment analysis to reveal transcripts putatively involved in potential relevant biological processes and signaling pathways. The most relevant processes found in these comparisons were stress, apoptosis, cell differentiation, angiogenesis, focal adhesion, ECM-receptor interaction, ion transport, angiogenesis, mitosis and cell cycle, inflammatory response, olfactory transduction and regulation of actin cytoskeleton. In addition, the most important overrepresented pathways were MAPK, ErbB, JAK/STAT, Toll and Nod like receptors, Angiotensin II, Arachidonic acid metabolism, Wnt and coagulation cascade. Also, new insights were gained about the underlying protection mechanisms against renal IRI promoted by IPC and Hemin treatment. Venn diagram analysis allowed us to uncover common and exclusively differentially expressed genes between these two protective maneuvers, underscoring potential common and exclusive biological functions regulated in each case. In summary, IPC exclusively regulated the expression of genes belonging to stress, protein modification and apoptosis, highlighting the role of IPC in controlling exacerbated stress response. Treatment with the Hmox1 inducer Hemin, in turn, exclusively regulated the expression of genes associated with cell differentiation, metabolic pathways, cell cycle, mitosis, development, regulation of actin cytoskeleton and arachidonic acid metabolism, suggesting a pleiotropic effect for Hemin. These findings improve the biological understanding of how the kidney behaves after IRI. They also illustrate some possible underlying molecular mechanisms involved in kidney protection observed with IPC or Hemin treatment maneuvers.


Conflict of interest statement

Competing Interests: The authors have declared that no competing interests exist.

Figures

Figure 1
Figure 1. Mean ± standard deviation of serum creatinine concentrations found in mice submitted to different experimental manipulations.
C57BL/6 male mice were subjected to surgical and treatment procedures as per described in Materials and Methods. Levels of serum creatinine were measured using the modified Jaffé technique. *Groups were statistically compared using ANOVA followed by Tukey’s post hoc test with p<0.05.
Figure 2
Figure 2. Top ranked biological functions after renal ischemia/reperfusion injury.
A) KEGG categories showing significant enriched functions for differentially expressed genes at IRI vs Control comparison; B) Biological Process Ontology (GO) of the differentially expressed genes observed at IRI vs Control comparison. The bar plot represents the percentage of genes differentially expressed and functionally annotated in isolated kidney tissue. Bar plot colors represent up (red) and down (green) regulated genes.
Figure 3
Figure 3. Top ranked biological functions associated with renal ischemic pre-conditioning.
A) KEGG categories showing significant enriched functions for differentially expressed genes at IPC+IRI vs IRI comparison; B) Biological Process Ontology (GO) of the differentially expressed genes observed at IPC+IRI vs IRI comparison. The bar plot represents the percentage of genes differentially expressed and functionally annotated in isolated kidney tissue. Bar plot colors represent up (red) and down (green) regulated genes.
Figure 4
Figure 4. Top ranked biological functions after renal ischemic pre-conditioning and ischemia/reperfusion injury.
A) KEGG categories showing significant enriched functions for differentially expressed genes at IPC+IRI vs Control comparison; B) Biological Process Ontology (GO) of the differentially expressed genes at IPC+IRI vs Control comparison. The bar plot represents the percentage of genes differentially expressed and functionally annotated in isolated kidney tissue. Bar plot colors represent up (red) and down (green) regulated genes.
Figure 5
Figure 5. Top ranked biological functions after renal ischemia/reperfusion injury in mice that received previous hemin treatment.
A) KEGG categories showing significant enriched functions for differentially expressed genes at IRI+Hemin vs IRI comparison; B) Biological Process Ontology (GO) of the differentially expressed genes at IRI+Hemin vs IRI comparison. The bar plot represents the percentage of genes differentially expressed and functionally annotated in isolated kidney tissue. Bar plot colors represent up (red) and down (green) regulated genes.
Figure 6
Figure 6. Top ranked biological functions after hemin treatment.
A) KEGG categories showing significant enriched functions for differentially expressed genes at Hemin vs Control comparison; B) Biological Process Ontology (GO) of the differentially expressed genes at Hemin vs Control comparison. The bar plot represents the percentage of genes differentially expressed and functionally annotated in isolated kidney tissue. Bar plot colors represent up (red) and down (green) regulated genes.
Figure 7
Figure 7. Venn diagram of microarray results reveals similarities and differences in differential transcriptome profiles regulated by IRI, IPC Hemin treatment protocols.
A) Venn diagram visualizing the overlapping results between the differentially regulated genes found at IRI vs Control, IRI+Hemin vs IRI and IPC+IRI vs IRI comparisons. B) Biological Process Ontology (GO) of the commonly differentially expressed genes found at IPC+IRI vs IRI and IRI+Hemin vs IRI comparisons. The red color of the bar plots represent up-regulated genes.
Figure 8
Figure 8. Top ranked biological functions of the exclusively differentially expressed genes regulated by IPC and Hemin treatment.
A) KEGG categories showing significant functional enrichment of the exclusively differentially expressed genes found at IPC+IRI vs IRI and IRI+Hemin vs IRI comparisons. B) Biological Process Ontology (GO) of the exclusively differentially expressed genes found at IPC+IRI vs IRI and IRI+Hemin vs IRI comparisons. The red color of the bar plots represent up-regulated genes.
Figure 9
Figure 9. Validation of microarray results by qRT-PCR analysis.
Expression of the genes Hmox-1 (A), Fosl1 (B) and Cxcl1 (C), were evaluated by microarray and qRT-PCR experiments. In microarray experiments, values are represented by log2-transformed gProcessed signal. For qRT-PCT, the relative RNA amounts were calculated using the comparative method 2-ΔΔCT and Hprt as an internal control. Results are shown as Boxplot format with whiskers from minimum to maximum values. *p<0.05 compared to Control.
Figure 10
Figure 10. Validation of microarray results by qRT-PCR analysis.
Expression of the genes Ccl5 (A), Hoxd4 (B), Muc20 (C) and Socs3 (D) were evaluated by microarray and qRT-PCR experiments. In microarray experiments, values are represented by log2-transformed gProcessed signal. For qRT-PCT, the relative RNA amounts were calculated using the comparative method 2-ΔΔCT and Hprt as an internal control. Results are shown as Boxplot format with whiskers from minimum to maximum values. *p<0.05 compared to Control; **p<0.05 compared to IRI; ***p<0.05 compared to Hemin.
Figure 11
Figure 11. Linear regression analysis revealed a good degree of correlation (R2 = 0.6161) between oligonucleotide microarray and quantitative RT-PCR.
Horizontal axis, values obtained with microarray experiments; vertical axis, values obtained with qRT-PCR.

Similar articles

Cited by

References

    1. Liano F, Pascual J (1996) Epidemiology of acute renal failure: a prospective, multicenter, community-based study. Madrid Acute Renal Failure Study Group. Kidney Int 50: 811–818. - PubMed
    1. Jang HR, Rabb H (2009) The innate immune response in ischemic acute kidney injury. Clin Immunol 130: 41–50. - PMC - PubMed
    1. Brezis M, Epstein FH (1993) Cellular mechanisms of acute ischemic injury in the kidney. Annu Rev Med 44: 27–37. - PubMed
    1. Sutton TA, Molitoris BA (1998) Mechanisms of cellular injury in ischemic acute renal failure. Semin Nephrol 18: 490–497. - PubMed
    1. Stroo I, Stokman G, Teske GJ, Raven A, Butter LM, et al. (2010) Chemokine expression in renal ischemia/reperfusion injury is most profound during the reparative phase. Int Immunol 22: 433–442. - PMC - PubMed

Publication types