. 2012;7(11):e49637.
doi: 10.1371/journal.pone.0049637. Epub 2012 Nov 15.

Bidirectional scaling of astrocytic metabotropic glutamate receptor signaling following long-term changes in neuronal firing rates

Affiliations

Bidirectional scaling of astrocytic metabotropic glutamate receptor signaling following long-term changes in neuronal firing rates

Alison X Xie et al. PLoS One. 2012.

Abstract

Very little is known about the ability of astrocytic receptors to exhibit plasticity as a result of changes in neuronal activity. Here we provide evidence for bidirectional scaling of astrocytic group I metabotropic glutamate receptor signaling in acute mouse hippocampal slices following long-term changes in neuronal firing rates. Plasticity of astrocytic mGluRs was measured by recording spontaneous and evoked Ca²⁺ elevations in both astrocytic somata and processes. An exogenous astrocytic Gq G protein-coupled receptor was resistant to scaling, suggesting that the alterations in astrocyte Ca²⁺ signaling result from changes in activity of the surface mGluRs rather than a change in intracellular G protein signaling molecules. These findings suggest that astrocytes actively detect shifts in neuronal firing rates and adjust their receptor signaling accordingly. This type of long-term plasticity in astrocytes resembles neuronal homeostatic plasticity and might be important to ensure an optimal or expected level of input from neurons.


Conflict of interest statement

Competing Interests: The authors have declared that no competing interests exist.

Figures

Figure 1
Figure 1. Firing rates of CA3 neurons in hippocampal slices as a function of [K+]o.
(A) Whole-cell current clamp recording of CA3 neuron membrane potential indicated that CA3 neurons rarely fired spontaneous action potentials in 2.5 mM [K+]o ACSF (n = 12), while in 3.5 mM [K+]o ACSF, CA3 neurons fired occasional spontaneous APs (n = 8). CA3 neurons were significantly depolarized in 5 mM [K+]o ACSF and regularly fired APs (n = 15). (B) There was a significant difference in membrane potential between CA3 neurons incubated in 2.5 mM [K+]o ACSF vs. those incubated in 3.5 mM and 5.0 mM [K+]o ACSF. Neurons became more depolarized with increasing [K+]o. (C) CA3 neurons incubated in 3.5 mM and 5.0 mM [K+]o ACSF had more spontaneous action potentials than those incubated in 2.5 mM [K+]o ACSF. (D) The distribution of frequency of spontaneous action potentials from individual CA3 neurons tested. In general, CA3 neurons incubated in 3.5 mM and 5.0 mM [K+]o ACSF had more frequent spontaneous APs compared to those incubated in 2.5 mM [K+]o ACSF.
Figure 2
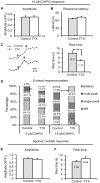
Figure 2. Long-term blockade of neuronal action potentials potentiates Ca2+ signaling in superficial bulk-loaded astrocytes.
(A) CA1 s.r. astrocytes loaded with Ca2+ Green 1-AM. Numbered ROIs were placed over astrocyte cell bodies, and match corresponding fluorescence traces in B. Scale bar, 10 µm. (B) Representative traces of Ca2+ activity from each astrocyte over time. 50 µM DHPG was applied at the end of each recording to evoke group I mGluR-mediated astrocyte Ca2+ responses. Three different Gq GPCR Ca2+ elevation patterns are shown: A spontaneous Ca2+ transient and “single-peak” event (ellipse); agonist-evoked “multi-peak” Ca2+ elevations (solid rectangles); and an agonist-evoked “plateau” Ca2+ elevation (dashed rectangle). (C) There was a trend toward a larger percentage of astrocytes in the population exhibiting spontaneous Gq GPCR Ca2+ activity after 4–6 hr. incubation in TTX compared to controls. This trend became significant in subsequent bolus-loading and patch clamp experiments. (D) and (E) No difference was found in amplitude (p = 0.08) or frequency of spontaneous Ca2+ transients between control and TTX-treated astrocytes (24/215 astrocytes in control conditions exhibited spontaneous Ca2+ transients; 36/218 astrocytes in TTX exhibited spontaneous Ca2+ transients). (F) No change was found in amplitude of DHPG-evoked Ca2+ responses between control and TTX-treated astrocytes. (G) TTX-treated astrocytes had significantly faster rise times of their DHPG-evoked Ca2+ responses. Representative traces show the difference in rise time with arrows indicating onset and peak. (H) Overall there was no difference in the percentage of TTX-treated astrocytes responding to 50 µM DHPG with Ca2+ elevations compared to control. (I) Astrocytes incubated in TTX displayed a significant shift toward multi-peak and plateau type DHPG-evoked Ca2+ responses compared to astrocytes in control conditions (p<0.001).
Figure 3
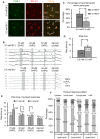
Figure 3. Astrocyte spontaneous Gq GPCR activity is enhanced after 4–6 hr incubation in TTX.
(A) SR-101 and OGB-1 AM loaded astrocytes in a control and TTX-incubated slice. Numbered ROIs match Ca2+ traces in (B). Scale bar, 10 µm. (B) Representative Ca2+ activity over time in astrocyte cell bodies. Ellipse indicates spontaneous Ca2+ transient; double rectangle, single rectangle with solid outline and dashed rectangle indicate agonist-evoked single peak, multi-peak, and plateau type Ca2+ elevations, respectively. Summary of DHPG-evoked responses is presented in figure 4. Note that lower concentrations of DHPG were applied for a longer period of time, especially in the control condition, as it was difficult to determine if the cells were responding to the agonist. TTX-treated astrocytes gave much more obvious responses to 5 µM DHPG compared to control. (C) The percentage of spontaneously active astrocytes in deeper tissue was significantly higher than astrocytes loaded near the slice surface (Control bolus-loaded: n = 40; Control bulk-loaded: n = 215; TTX bolus-loaded: n = 30; TTX bulk-loaded: n = 218). (D) The percentage of astrocytes exhibiting spontaneous Ca2+ transients in the soma and main processes was significantly increased following TTX treatment compared to control. (E) Rise time of the spontaneous Ca2+ transients was significantly faster in TTX-treated astrocytes (n = 27) compared to controls (n = 32).
Figure 4
Figure 4. Astrocyte evoked Group I mGluR activity is enhanced after 4–6 hr incubation in TTX.
(A) and (B) The amplitude and response latency of evoked Ca2+ responses to 15 µM DHPG were unchanged after 4–6 hr. incubation in TTX compared to control. (C) Rise time of the evoked Ca2+ responses to 15 µM DHPG was significantly faster in TTX treated astrocytes (n = 27) compared to controls (n = 32). (D) A greater percentage of TTX-treated astrocytes responded to low concentrations of DHPG, with a shift toward a plateau pattern compared to control astrocytes. Please refer to representative traces in Figure 3B. (E) and (F) The amplitude and rise time of Ca2+ responses to agonist cocktail were unchanged.
Figure 5
Figure 5. Patch clamp of astrocytes with OGB-1 Ca2+ indicator dye enables recording of Ca2+ transients in fine astrocyte processes.
(A) Single astrocyte filled with OGB-1 and Alexa 568 via patch pipette. Images were obtained using the same laser power with which Ca2+ recording was performed. (B) The same astrocyte as in (A) imaged using higher laser power reveals the fine processes after Ca2+ recording. ROIs were placed over the fine processes of the astrocyte using the Alexa 568 overlay. Scale bar, 10 µm (images shown at same magnification as those in (A)). (C) Calcium activity over time within ROIs indicated in (B). Traces without arrows indicate spontaneous and agonist-evoked Ca2+ activity in the astrocyte. Arrows indicate ROIs that were placed where there was no visible Alexa 568 signal (background).
Figure 6
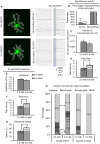
Figure 6. Long-term blockade of neuronal APs potentiates spontaneous Ca2+ signaling in astrocyte microdomains.
(A) OGB-1 loaded single astrocyte with equal sized boxes placed over its fine processes, which are visible in the left panel. Scale bar, 10 µm. (B) Traces of spontaneous microdomain Ca2+ activity and DHPG-evoked Ca2+ responses match numbered ROIs from cell in (A). (C) The astrocyte in (A) exhibited passive currents when the membrane was stepped from −180 to +80 mV in 20 mV increments. A test pulse of −5 mV was included after each voltage step in order to monitor changes in access resistance. (D) After TTX treatment, spontaneous Ca2+ oscillations frequently occurred in the astrocyte soma (n = 11), while most astrocytes in control conditions very rarely had spontaneous somatic Ca2+ transients (n = 10). (E) and (F) TTX treated astrocytes (n = 58 microdomains/11 cells) exhibited a trend toward a greater number of microdomains per cell compared to controls (n = 29 microdomains/10 cells). There was no change in the frequency of spontaneous microdomain Ca2+ activity. (G) and (H) Spontaneous microdomain Ca2+ transients had significantly larger areas of propagation and a faster rise time after TTX treatment.
Figure 7
Figure 7. Long-term blockade of neuronal APs potentiates evoked group I mGluR Ca2+ responses in astrocyte microdomains.
(A), (B) and (C) While amplitude remained unchanged, Ca2+ elevations in TTX-treated astrocytes (n = 56 microdomains/11 cells) exhibited a faster rise time and a shorter latency to respond to 50 µM DHPG compared to controls (n = 28 microdomains/10 cells). (D) The pattern of astrocyte microdomain Ca2+ responses evoked by 50 µM DHPG shifted from the weaker single peak phenotype towards the more robust plateau type after TTX treatment. (E) Rise time of astrocyte microdomain Ca2+ responses evoked by agonist cocktail was not significantly different in the TTX treated vs. control group (control: n = 40 cells; TTX: n = 30 cells).
Figure 8
Figure 8. Increased neuronal firing rates depress spontaneous and evoked group I mGluR astrocyte Ca2+ transients.
(A) SR-101 and OGB-1 loaded astrocytes in 2.5 mM and 5.0 mM [K+]o incubated slices. Numbered ROIs match Ca2+ traces in (B). Scale bar, 10 µm. (B) Calcium activity from 2.5 mM and 5.0 mM [K+]o incubated slices shown in (A). 5.0 mM [K+]o treated astrocytes exhibited fewer spontaneous somatic Ca2+ transients and weaker DHPG evoked responses compared to 2.5 mM [K+]o ACSF. Note that DHPG application times tended to be longer in 5.0 mM [K+]o treated astrocytes compared to control, as it required more time before a Ca2+ response was clearly evident in experimental vs. control conditions. Also, cell 1 in 2.5 mM [K+]o ACSF was rejected from further analysis as it did not respond to agonist cocktail. (C) The percentage of spontaneously active astrocytes was significantly lower in 5.0 mM [K+]o treated (n = 51 cells/10 slices) vs. control slices (n = 52 cells/10 slices). (D) Rise time of somatic spontaneous Ca2+ transients in 5.0 mM [K+]o treated astrocytes (n = 13) was significantly slower compared to controls (n = 30). (E) Rise time of evoked somatic astrocyte Ca2+ responses to three concentrations of DHPG was slower in 5.0 mM [K+]o treated vs. control astrocytes. (F) At all DHPG concentrations tested, a lower percentage of 5.0 mM [K+]o treated astrocytes responded to DHPG, and the pattern of responses shifted toward the weaker single-peak phenotype, compared to 2.5 mM [K+]o incubated astrocytes.
Figure 9
Figure 9. Increased neuronal firing rates depress spontaneous and evoked group I mGluR Ca2+ transients in microdomains.
(A) OGB-1 loaded astrocytes treated with either 2.5 mM or 5.0 mM [K+] ACSF. Cells are shown with equal sized (3.5 µm/side) ROIs placed over astrocyte processes. Traces of spontaneous microdomain Ca2+ activity and 50 µM DHPG-evoked Ca2+ elevations match numbered ROIs in the images. (B) Spontaneous Ca2+ transients occurred in microdomains of all s.r. astrocytes, while a lower percentage of 5.0 mM [K+]o treated astrocytes (n = 14) had spontaneous Ca2+ activity in the soma compared to control astrocytes (n = 12). (C) 5.0 mM [K+]o treated astrocytes exhibited a trend toward a lower number of spontaneous Ca2+ microdomains per cell compared to controls (n = 51 microdomains/11 cells in 5 mM [K+]o; n = 71 microdomains/12 cells in 2.5 mM [K+]o). (D) Rise time of spontaneous microdomain Ca2+ transients was slower after 4–6 hr. incubation in 5.0 mM [K+]o compared to control [K+]o. (E), (F) and (G) Ca2+ elevations evoked by DHPG in 5.0 mM [K+]o treated astrocytes (n = 37 microdomains/11 cells) had a significantly slower rise time and longer response latency compared to those in the control condition (n = 69 microdomains/12 cells). Amplitude of microdomain DHPG responses was unchanged. (H) Summary of the evoked Ca2+ response patterns in astrocyte microdomains. 31.4% of microdomains in 5.0 mM [K+]o treated astrocytes did not respond to 50 µM DHPG, while only 2.8% of microdomains in 2.5 mM [K+]o treated astrocytes did not respond to the agonist. There was also a significant shift away from the plateau responses in the microdomains after incubation in 5.0 mM [K+]o toward the weaker, single-peak response type.
Figure 10
Figure 10. Astrocytic MrgA1R Ca2+ signaling is not affected by long-term blockade of neuronal APs.
(A) A single MrgA1R+ hippocampal s.r. astrocyte filled with OGB-1 Ca2+ indicator dye by patch clamp from a control-incubated hippocampal slice. Equal sized boxes of 3.5 µm/side (12.3 µm2) were placed over astrocyte processes to study microdomain Gq GPCR activity (top middle panel) and match corresponding Ca2+ traces in (B). Scale bar, 10 µm. (B) Representative traces of Ca2+ activity from all ROIs in the same astrocyte shown in (A). The Ca2+ trace at the bottom is from the cell soma, which is ROI #1. The MrgA1R agonist FMRFa evoked Ca2+ elevations similar to those produced by tACPD and agonist cocktail. The spontaneous Ca2+ activity in microdomains A and B are highlighted by solid and dashed rectangles, respectively. (C) The rise time of Ca2+ responses evoked by 1 and 4 µM FMRFa was no different in TTX treated vs. control astrocytes (control: n = 9 microdomains/8 cells; TTX: n = 14 microdomains/10 cells). The rise time of tACPD evoked Ca2+ responses was significantly faster in TTX treated astrocytes, similar to observations using DHPG in wild type hippocampal slices.

Similar articles

Cited by

References

    1. Porter JT, McCarthy KD (1996) Hippocampal astrocytes in situ respond to glutamate released from synaptic terminals. J Neurosci 16: 5073–5081. - PMC - PubMed
    1. Wang X, Lou N, Xu Q, Tian GF, Peng WG, et al. (2006) Astrocytic Ca2+ signaling evoked by sensory stimulation in vivo. Nat Neurosci 9: 816–823. - PubMed
    1. Schummers J, Yu H, Sur M (2008) Tuned responses of astrocytes and their influence on hemodynamic signals in the visual cortex. Science 320: 1638–1643. - PubMed
    1. Dombeck DA, Khabbaz AN, Collman F, Adelman TL, Tank DW (2007) Imaging large-scale neural activity with cellular resolution in awake, mobile mice. Neuron 56: 43–57. - PMC - PubMed
    1. Araque A, Martin ED, Perea G, Arellano JI, Buno W (2002) Synaptically released acetylcholine evokes Ca2+ elevations in astrocytes in hippocampal slices. J Neurosci 22: 2443–2450. - PMC - PubMed

Publication types

Substances