Dietary n-3 polyunsaturated fatty acids (PUFA) decrease obesity-associated Th17 cell-mediated inflammation during colitis
- PMID: 23166761
- PMCID: PMC3500317
- DOI: 10.1371/journal.pone.0049739
Dietary n-3 polyunsaturated fatty acids (PUFA) decrease obesity-associated Th17 cell-mediated inflammation during colitis
Abstract
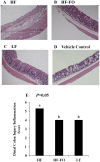
Clinical and experimental evidence suggests that obesity-associated inflammation increases disease activity during colitis, attributed in part to the effects of Th17 cells. Using a model of concurrent obesity and colitis, we monitored changes in critical immune cell subsets and inflammatory biomarker expression in three key tissues: visceral adipose tissue, colon (local inflammatory site) and spleen (systemic inflammatory site), and we hypothesized that n-3 PUFA would reduce the percentage of inflammatory immune cell subsets and suppress inflammatory gene expression, thereby improving the disease phenotype. Obesity was induced in C57BL/6 mice by feeding a high fat (HF) diet (59.2% kcal) alone or an isocaloric HF diet supplemented with fish oil (HF-FO) for 12 weeks. Colitis was induced via a 2.5% trinitrobenzene sulfonic acid (TNBS) enema. The HF-FO diet improved the obese phenotype by reducing i) serum hormone concentrations (leptin and resistin), ii) adipose tissue mRNA expression of inflammatory cytokines (MCP-1, IFNγ, IL-6, IL17F and IL-21) and iii) total (F4/80⁺ CD11b⁺) and inflammatory adipose tissue M1 (F4/80⁺ CD11c⁺) macrophage content compared to HF (P<0.05). In addition, the HF-FO diet reduced both colitis-associated disease severity and colonic mRNA expression of the Th17 cell master transcription factor (RORγτ) and critical cytokines (IL-6, IL-17A, IL-17F, IL-21, IL-23 and IFNγ) versus HF (P<0.05). Compared to HF, the percentage of both splenic Th17 and Th1 cells were reduced by the HF-FO group (P<0.05). Under ex vivo polarizing conditions, the percentage of HF-FO derived CD4⁺ T cells that reached Th17 cell effector status was suppressed (P = 0.05). Collectively, these results indicate that n-3 PUFA suppress Th1/Th17 cells and inflammatory macrophage subsets and reconfigure the inflammatory gene expression profile in diverse tissue sites in obese mice following the induction of colitis.
Conflict of interest statement
Figures


Similar articles
-
Fish-oil-derived n-3 polyunsaturated fatty acids reduce NLRP3 inflammasome activity and obesity-related inflammatory cross-talk between adipocytes and CD11b(+) macrophages.J Nutr Biochem. 2016 Aug;34:61-72. doi: 10.1016/j.jnutbio.2016.04.004. Epub 2016 Apr 29. J Nutr Biochem. 2016. PMID: 27208584
-
Metabolic and immunomodulatory effects of n-3 fatty acids are different in mesenteric and epididymal adipose tissue of diet-induced obese mice.Am J Physiol Endocrinol Metab. 2013 Jun 1;304(11):E1140-56. doi: 10.1152/ajpendo.00171.2012. Epub 2013 Mar 12. Am J Physiol Endocrinol Metab. 2013. PMID: 23482450
-
Antagonizing arachidonic acid-derived eicosanoids reduces inflammatory Th17 and Th1 cell-mediated inflammation and colitis severity.Mediators Inflamm. 2014;2014:917149. doi: 10.1155/2014/917149. Epub 2014 Jul 17. Mediators Inflamm. 2014. PMID: 25136149 Free PMC article.
-
Interleukin-23 and T helper 17-type responses in intestinal inflammation: from cytokines to T-cell plasticity.Immunology. 2011 Aug;133(4):397-408. doi: 10.1111/j.1365-2567.2011.03454.x. Epub 2011 Jun 2. Immunology. 2011. PMID: 21631495 Free PMC article. Review.
-
n-3 polyunsaturated fatty acids and mechanisms to mitigate inflammatory paracrine signaling in obesity-associated breast cancer.Nutrients. 2014 Oct 30;6(11):4760-93. doi: 10.3390/nu6114760. Nutrients. 2014. PMID: 25360510 Free PMC article. Review.
Cited by
-
Nutritional concerns in pediatric inflammatory bowel disease.Korean J Pediatr. 2016 Jun;59(6):247-51. doi: 10.3345/kjp.2016.59.6.247. Epub 2016 Jun 30. Korean J Pediatr. 2016. PMID: 27462352 Free PMC article. Review.
-
The Role of Long-Chain Fatty Acids in Inflammatory Bowel Disease.Mediators Inflamm. 2019 Nov 3;2019:8495913. doi: 10.1155/2019/8495913. eCollection 2019. Mediators Inflamm. 2019. PMID: 31780872 Free PMC article. Review.
-
Eicosapentaenoic and docosahexaenoic acid ethyl esters differentially enhance B-cell activity in murine obesity.J Lipid Res. 2014 Jul;55(7):1420-33. doi: 10.1194/jlr.M049809. Epub 2014 May 17. J Lipid Res. 2014. PMID: 24837990 Free PMC article.
-
Experimental evidence of ω-3 polyunsaturated fatty acid modulation of inflammatory cytokines and bioactive lipid mediators: their potential role in inflammatory, neurodegenerative, and neoplastic diseases.Biomed Res Int. 2013;2013:743171. doi: 10.1155/2013/743171. Epub 2013 Apr 17. Biomed Res Int. 2013. PMID: 23691510 Free PMC article. Review.
-
Oleoylethanolamide treatment affects gut microbiota composition and the expression of intestinal cytokines in Peyer's patches of mice.Sci Rep. 2018 Oct 5;8(1):14881. doi: 10.1038/s41598-018-32925-x. Sci Rep. 2018. PMID: 30291258 Free PMC article.
References
-
- Flegal KM, Carroll MD, Kit BK, Ogden CL (2012) Prevalence of obesity and trends in the distribution of body mass index among US adults, 1999–2010. JAMA 307: 491–497. - PubMed
-
- Kahn SE, Hull RL, Utzschneider KM (2006) Mechanisms linking obesity to insulin resistance and type 2 diabetes. Nature 444: 840–846. - PubMed
-
- Kalupahana NS, Moustaid-Moussa N, Claycombe KJ (2012) Immunity as a link between obesity and insulin resistance. Mol Aspects Med 33: 26–34. - PubMed
-
- Flachs P, Horakova O, Brauner P, Rossmeisl M, Pecina P, et al. (2005) Polyunsaturated fatty acids of marine origin upregulate mitochondrial biogenesis and induce beta-oxidation in white fat. Diabetologia 48: 2365–2375. - PubMed
-
- Flachs P, Mohamed-Ali V, Horakova O, Rossmeisl M, Hosseinzadeh-Attar MJ, et al. (2006) Polyunsaturated fatty acids of marine origin induce adiponectin in mice fed a high-fat diet. Diabetologia 49: 394–397. - PubMed
Publication types
MeSH terms
Substances
Grants and funding
LinkOut - more resources
Full Text Sources
Medical
Research Materials
Miscellaneous

