

Sulforaphane inhibits prostaglandin E2 synthesis by suppressing microsomal prostaglandin E synthase 1
- PMID: 23166763
- PMCID: PMC3500324
- DOI: 10.1371/journal.pone.0049744
Sulforaphane inhibits prostaglandin E2 synthesis by suppressing microsomal prostaglandin E synthase 1
Abstract
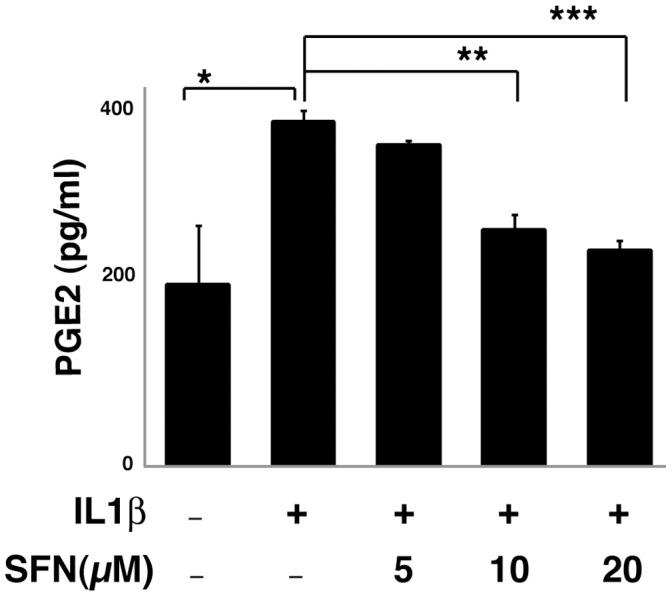
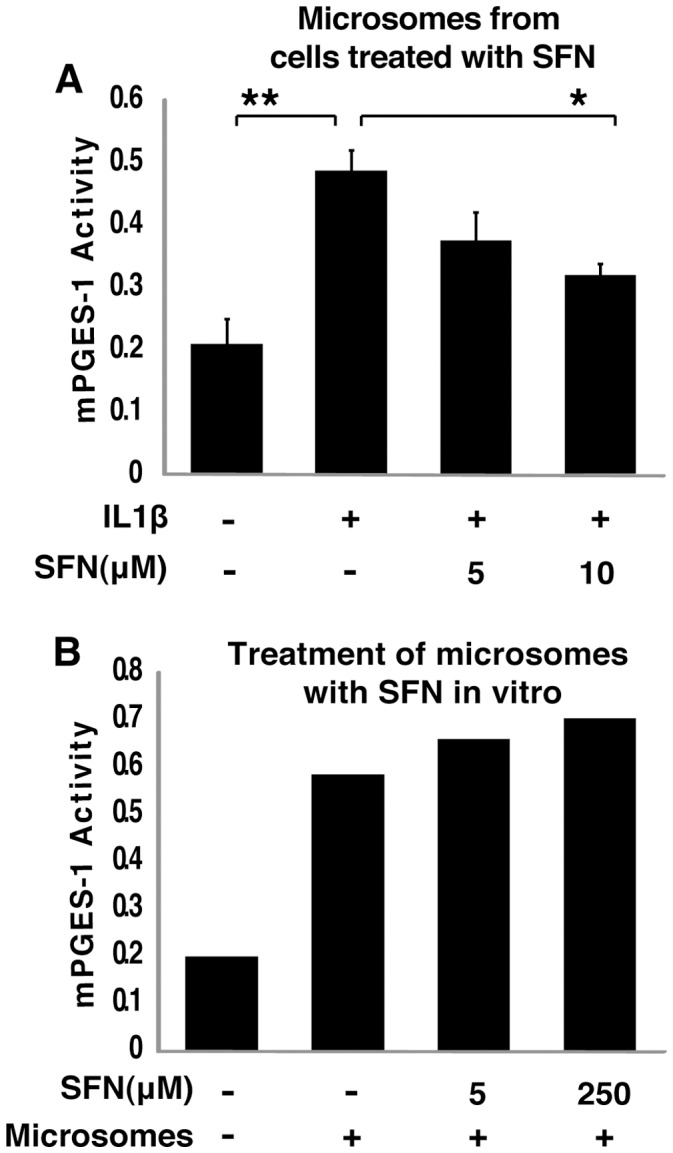
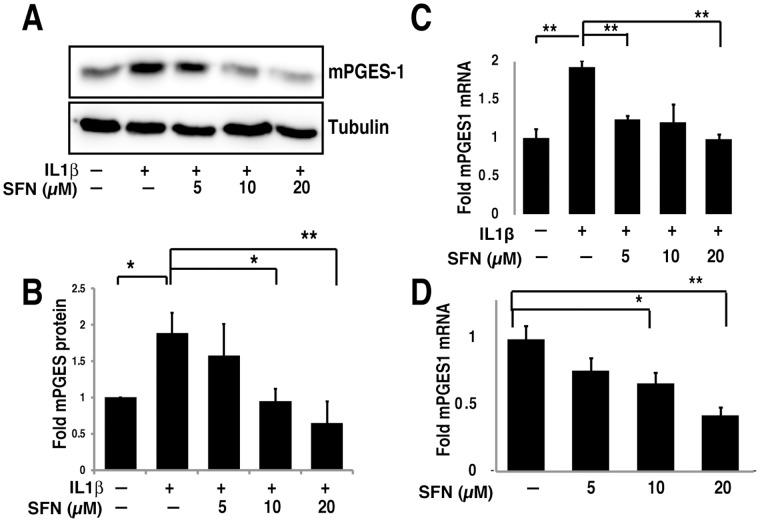
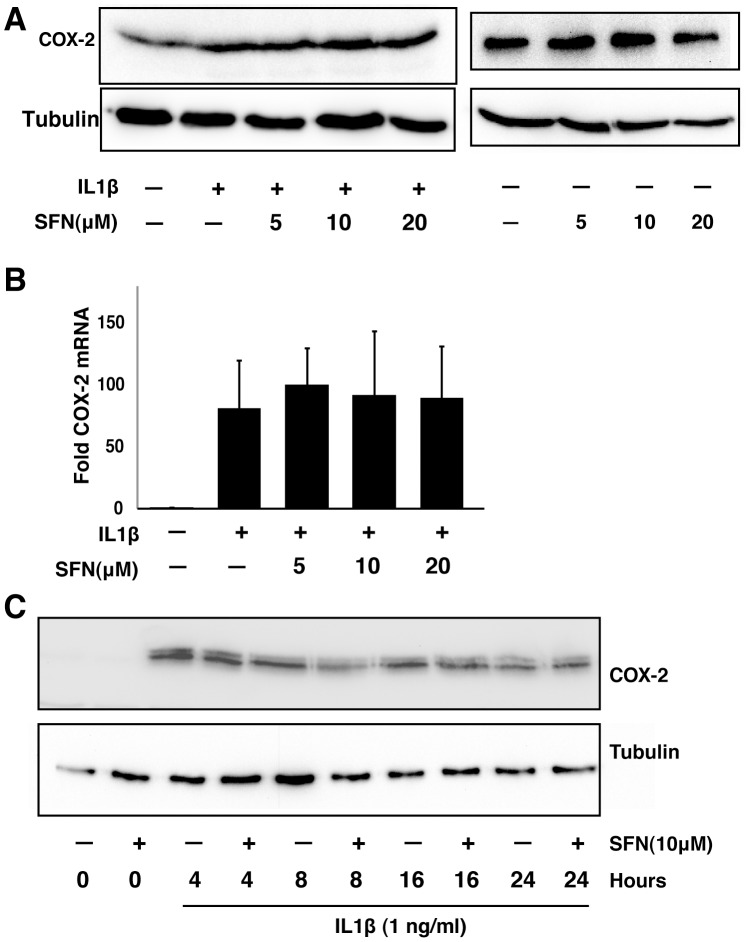
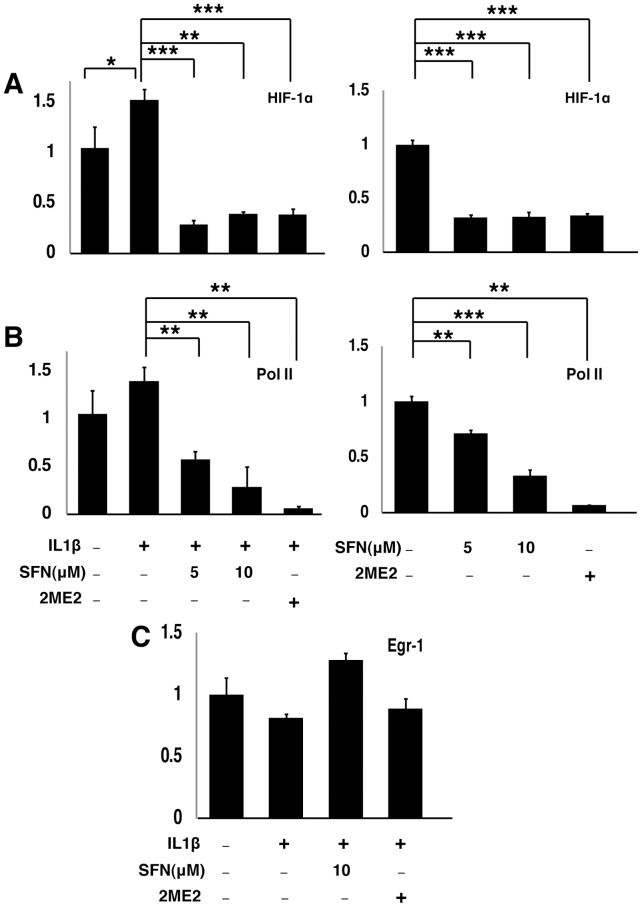
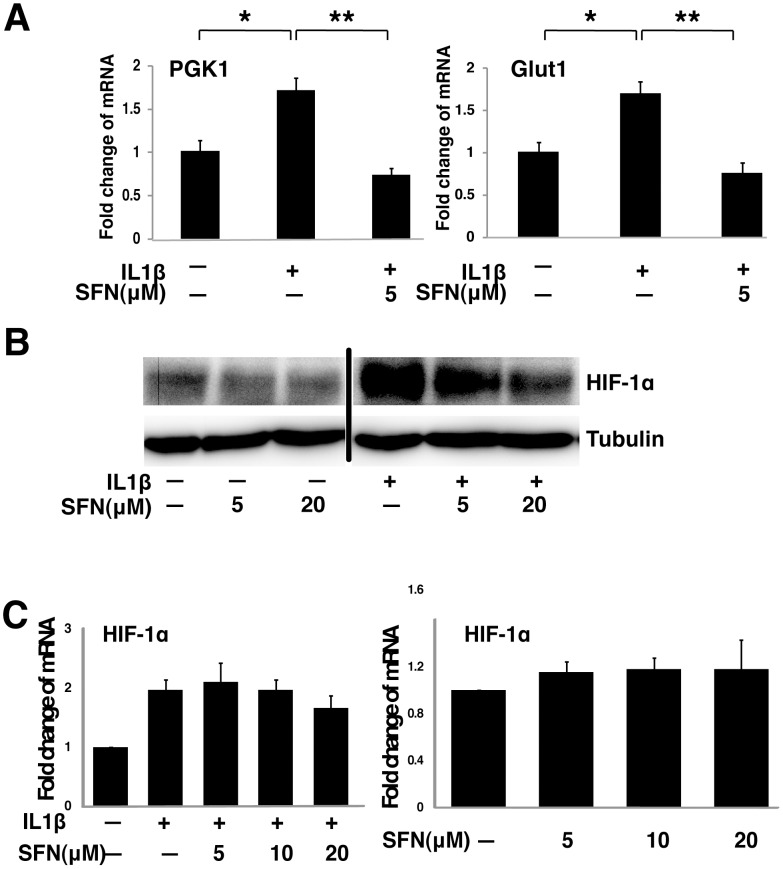
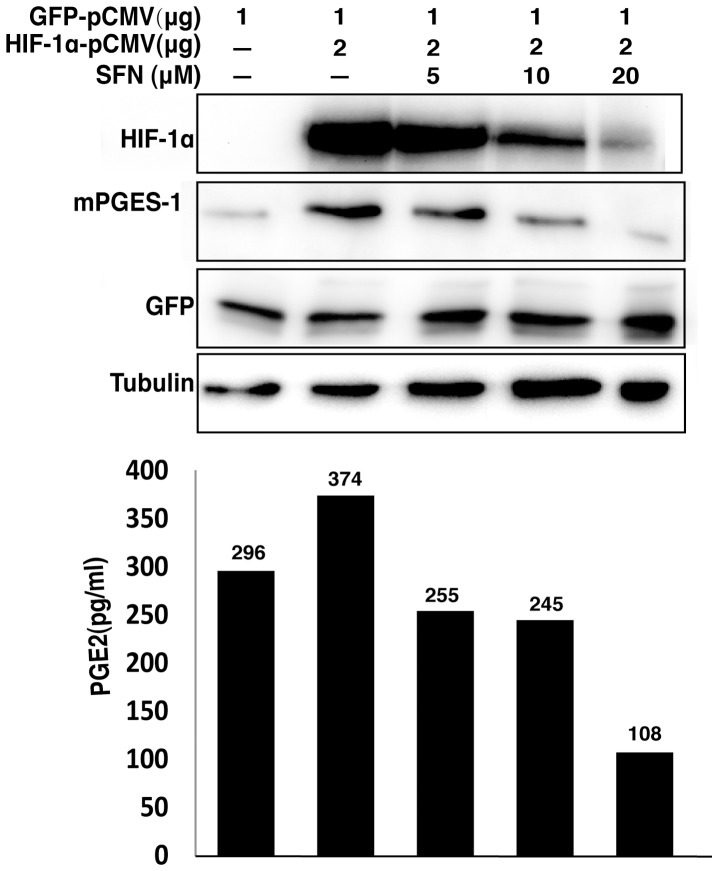
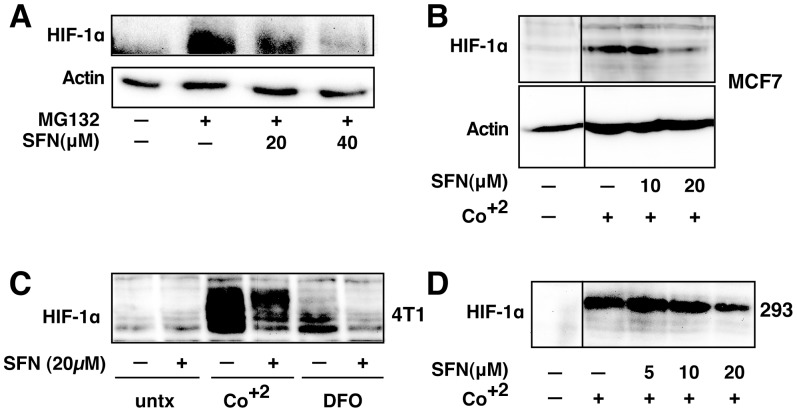
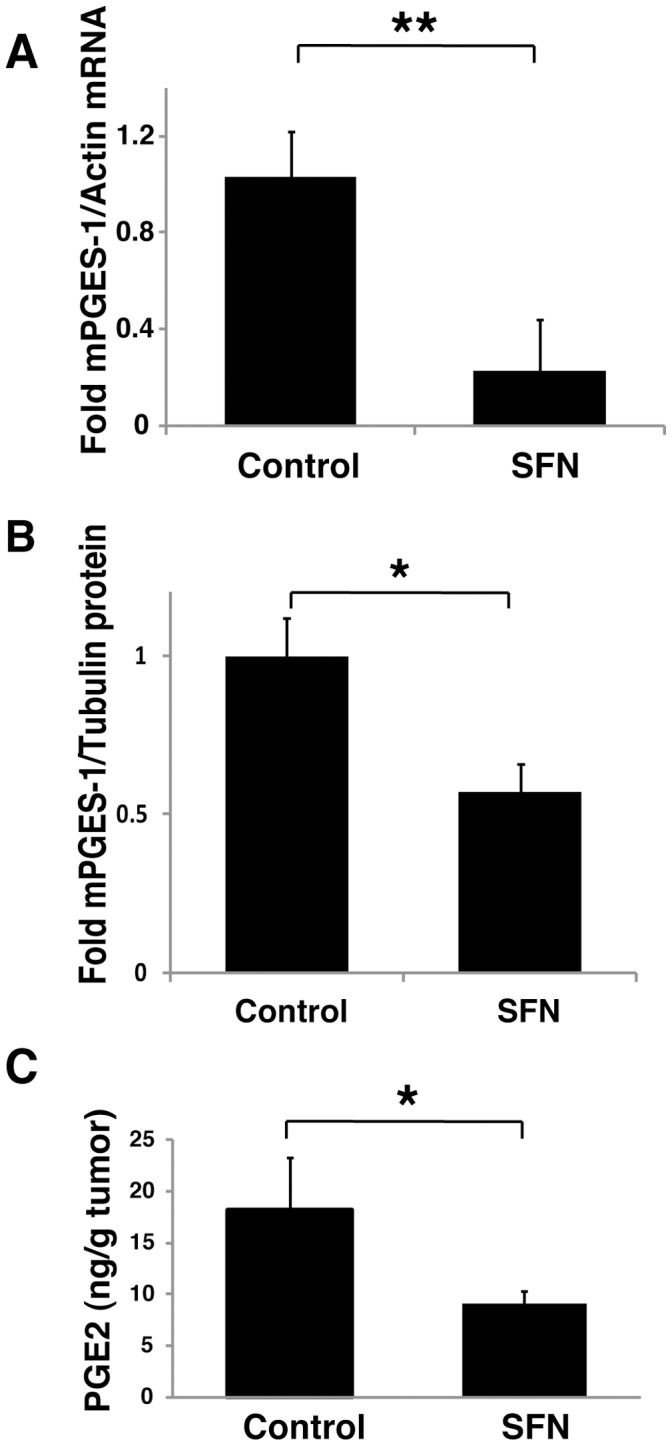
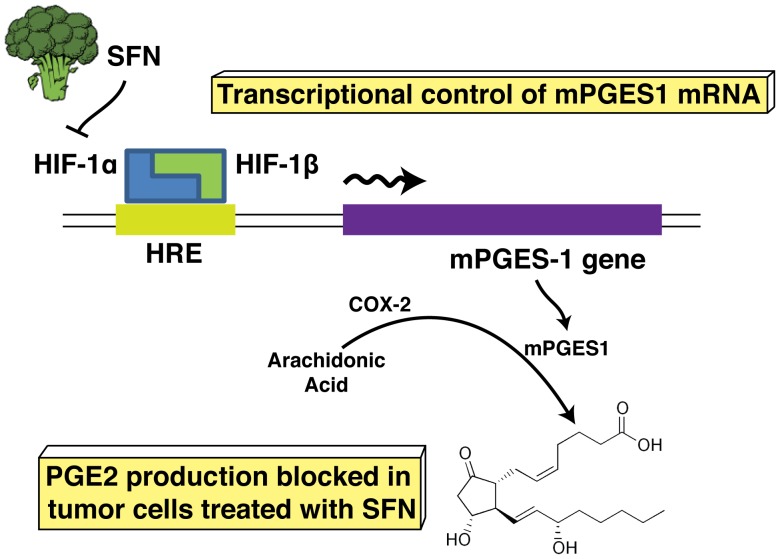
Sulforaphane (SFN) is a dietary cancer preventive with incompletely characterized mechanism(s) of cancer prevention. Since prostaglandin E2 (PGE2) promotes cancer progression, we hypothesized that SFN may block PGE2 synthesis in cancer cells. We found that SFN indeed blocked PGE2 production in human A549 cancer cells not by inhibiting COX-2, but rather by suppressing the expression of microsomal prostaglandin E synthase (mPGES-1), the enzyme that directly synthesizes PGE2. We identified the Hypoxia Inducible Factor 1 alpha (HIF-1α) as the target of SFN-mediated mPGES-1 suppression. SFN suppressed HIF-1α protein expression and the presence of HIF-1α at the mPGES-1 promoter, resulting in reduced transcription of mPGES-1. Finally, SFN also reduced expression of mPGES-1 and PGE2 production in A549 xenograft tumors in mice. Together, these results point to the HIF-1α, mPGES-1 and PGE2 axis as a potential mediator of the anti-cancer effects of SFN, and illustrate the potential of SFN for therapeutic control of cancer and inflammation. Harmful side effects in patients taking agents that target the more upstream COX-2 enzyme render the downstream target mPGES-1 a significant target for anti-inflammatory therapy. Thus, SFN could prove to be an important therapeutic approach to both cancer and inflammation.
Conflict of interest statement
Figures
Similar articles
-
Microglia-specific expression of microsomal prostaglandin E2 synthase-1 contributes to lipopolysaccharide-induced prostaglandin E2 production.J Neurochem. 2005 Sep;94(6):1546-58. doi: 10.1111/j.1471-4159.2005.03302.x. Epub 2005 Jul 5. J Neurochem. 2005. PMID: 16000148
-
Sulforaphane, a Chemopreventive Compound, Inhibits Cyclooxygenase-2 and Microsomal Prostaglandin E Synthase-1 Expression in Human HT-29 Colon Cancer Cells.Cells Tissues Organs. 2018;206(1-2):46-53. doi: 10.1159/000490394. Epub 2018 Jul 24. Cells Tissues Organs. 2018. PMID: 30041241
-
Deletion of microsomal prostaglandin E2 (PGE2) synthase-1 reduces inducible and basal PGE2 production and alters the gastric prostanoid profile.J Biol Chem. 2004 May 28;279(22):23229-37. doi: 10.1074/jbc.M400443200. Epub 2004 Mar 11. J Biol Chem. 2004. PMID: 15016822
-
Perspective of microsomal prostaglandin E2 synthase-1 as drug target in inflammation-related disorders.Biochem Pharmacol. 2015 Nov 1;98(1):1-15. doi: 10.1016/j.bcp.2015.06.022. Epub 2015 Jun 27. Biochem Pharmacol. 2015. PMID: 26123522 Review.
-
Microsomal prostaglandin E synthase-1: the inducible synthase for prostaglandin E2.Arthritis Res Ther. 2005;7(3):114-7. doi: 10.1186/ar1748. Epub 2005 Apr 6. Arthritis Res Ther. 2005. PMID: 15899061 Free PMC article. Review.
Cited by
-
Sulforaphane protects against acrolein-induced oxidative stress and inflammatory responses: modulation of Nrf-2 and COX-2 expression.Arch Med Sci. 2016 Aug 1;12(4):871-80. doi: 10.5114/aoms.2016.59919. Epub 2016 Jul 1. Arch Med Sci. 2016. PMID: 27478470 Free PMC article.
-
Beneficial effect of additional treatment with widely available anticancer agents in advanced small lung cell carcinoma: A case report.Mol Clin Oncol. 2018 Dec;9(6):647-650. doi: 10.3892/mco.2018.1736. Epub 2018 Oct 5. Mol Clin Oncol. 2018. PMID: 30546895 Free PMC article.
-
Effects of sulforaphane and 3,3'-diindolylmethane on genome-wide promoter methylation in normal prostate epithelial cells and prostate cancer cells.PLoS One. 2014 Jan 22;9(1):e86787. doi: 10.1371/journal.pone.0086787. eCollection 2014. PLoS One. 2014. PMID: 24466240 Free PMC article.
-
Herbal nutraceuticals: safe and potent therapeutics to battle tumor hypoxia.J Cancer Res Clin Oncol. 2020 Jan;146(1):1-18. doi: 10.1007/s00432-019-03068-x. Epub 2019 Nov 13. J Cancer Res Clin Oncol. 2020. PMID: 31724069 Free PMC article. Review.
-
Dioscorea japonica extract down-regulates prostaglandin E2 synthetic pathway and induces apoptosis in lung cancer cells.J Clin Biochem Nutr. 2014 Nov;55(3):162-7. doi: 10.3164/jcbn.14-25. Epub 2014 Sep 9. J Clin Biochem Nutr. 2014. PMID: 25411520 Free PMC article.
References
-
- Park JY, Pillinger MH, Abramson SB (2006) Prostaglandin E2 synthesis and secretion: the role of PGE2 synthases. Clin Immunol 119: 229–240. - PubMed
-
- Murakami M, Kudo I (2002) Phospholipase A2. J Biochem 131: 285–292. - PubMed
-
- Davies P, Bailey PJ, Goldenberg MM, Ford-Hutchinson AW (1984) The role of arachidonic acid oxygenation products in pain and inflammation. Annu Rev Immunol 2: 335–357. - PubMed
-
- Bianchi A, Moulin D, Sebillaud S, Koufany M, Galteau MM, et al. (2005) Contrasting effects of peroxisome-proliferator-activated receptor (PPAR)gamma agonists on membrane-associated prostaglandin E2 synthase-1 in IL-1beta-stimulated rat chondrocytes: evidence for PPARgamma-independent inhibition by 15-deoxy-Delta12,14prostaglandin J2. Arthritis Res Ther 7: R1325–1337. - PMC - PubMed
Publication types
MeSH terms
Substances
Grants and funding
LinkOut - more resources
Full Text Sources
Research Materials
Miscellaneous
