. 2012;7(11):e49830.
doi: 10.1371/journal.pone.0049830. Epub 2012 Nov 16.

Whole number, distribution and co-expression of brn3 transcription factors in retinal ganglion cells of adult albino and pigmented rats

Affiliations

Whole number, distribution and co-expression of brn3 transcription factors in retinal ganglion cells of adult albino and pigmented rats

Francisco M Nadal-Nicolás et al. PLoS One. 2012.

Abstract

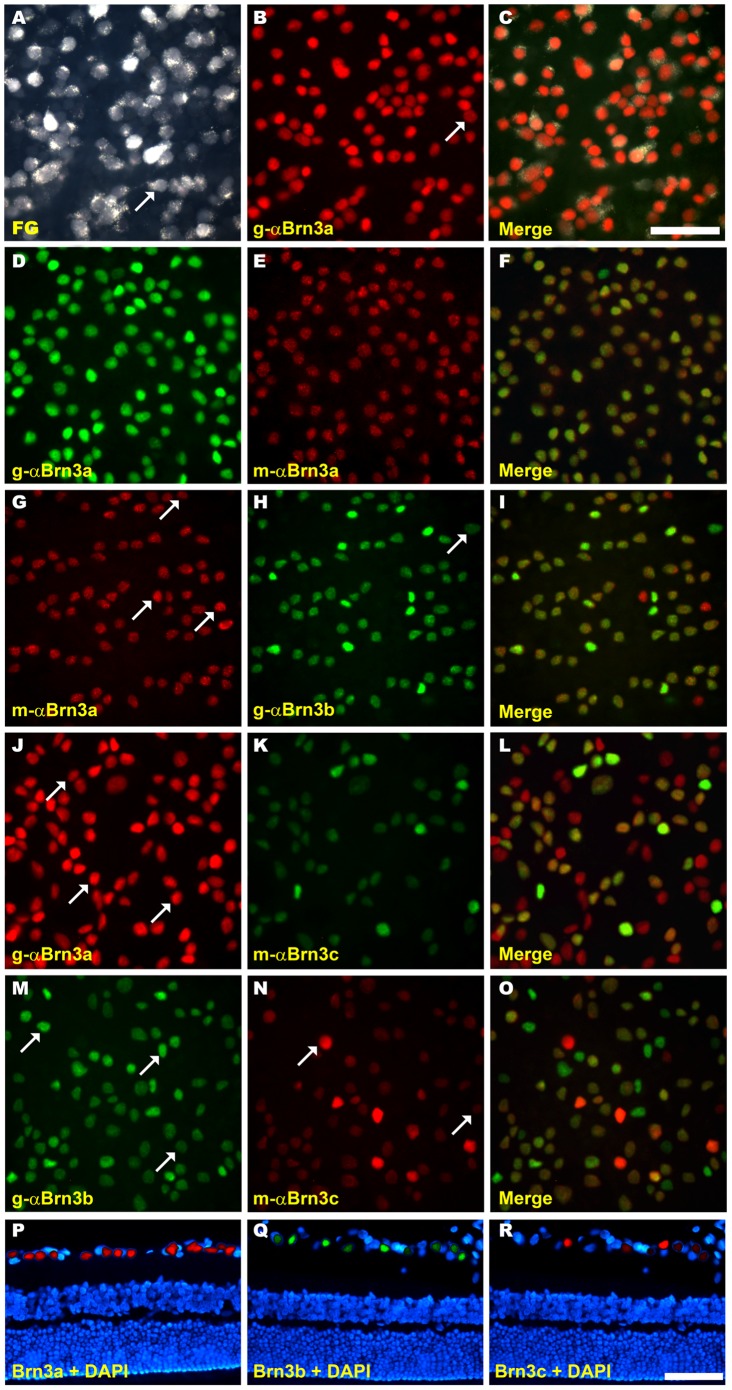
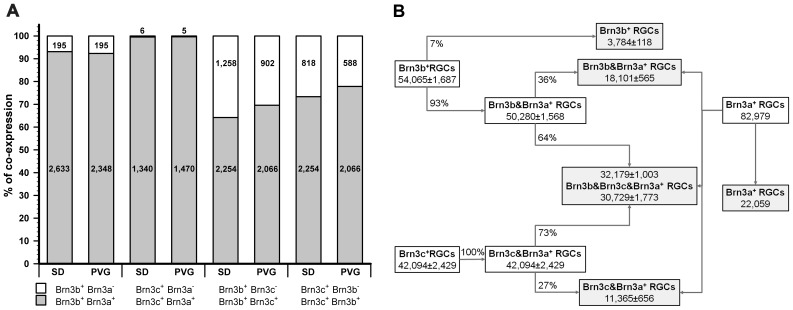
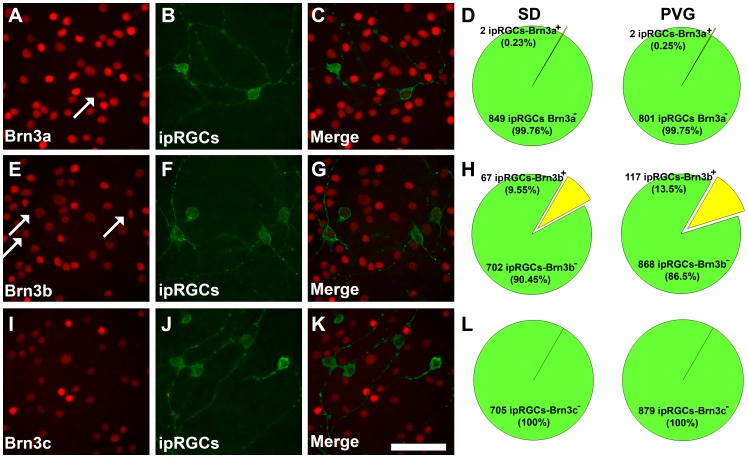
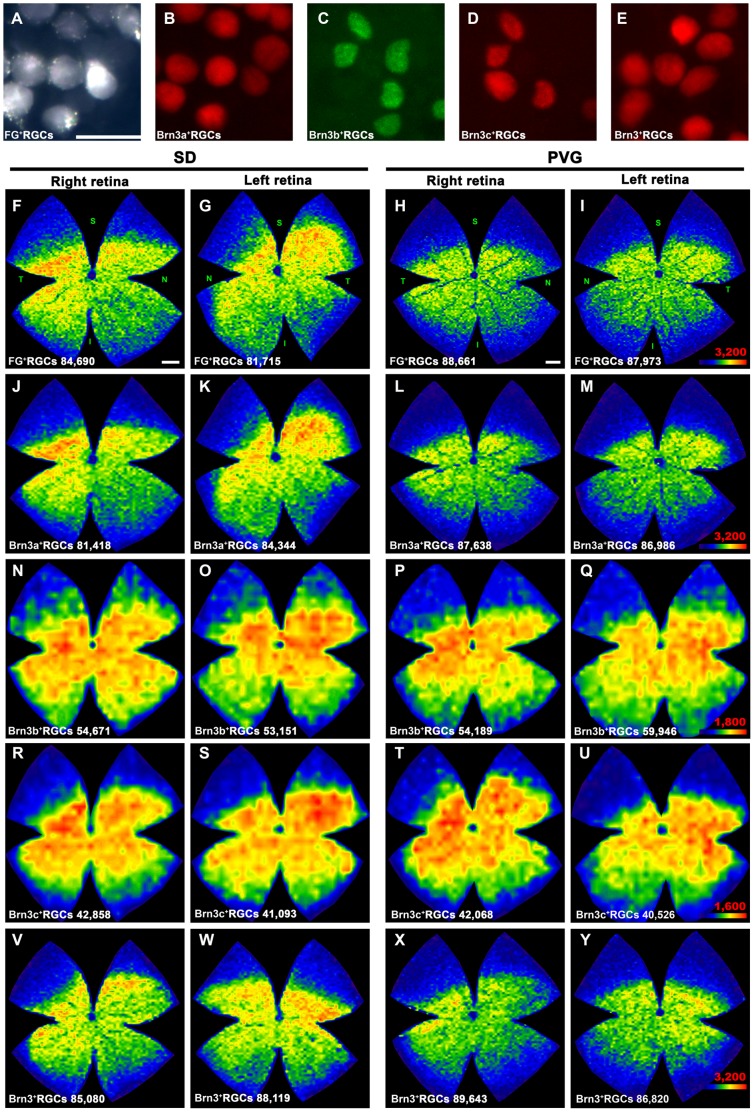
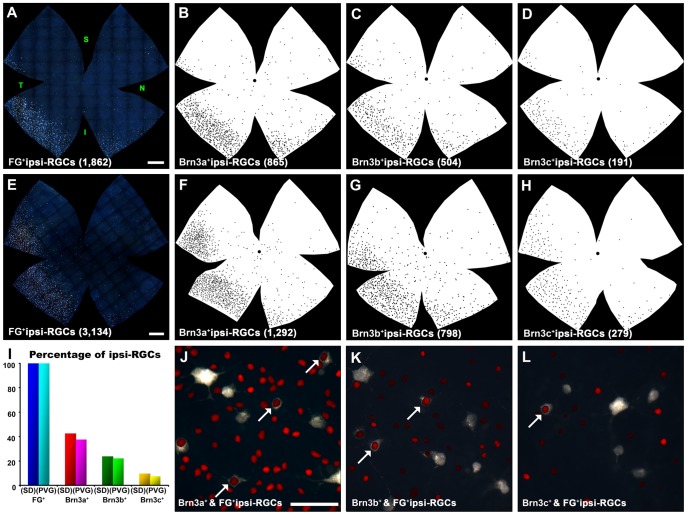
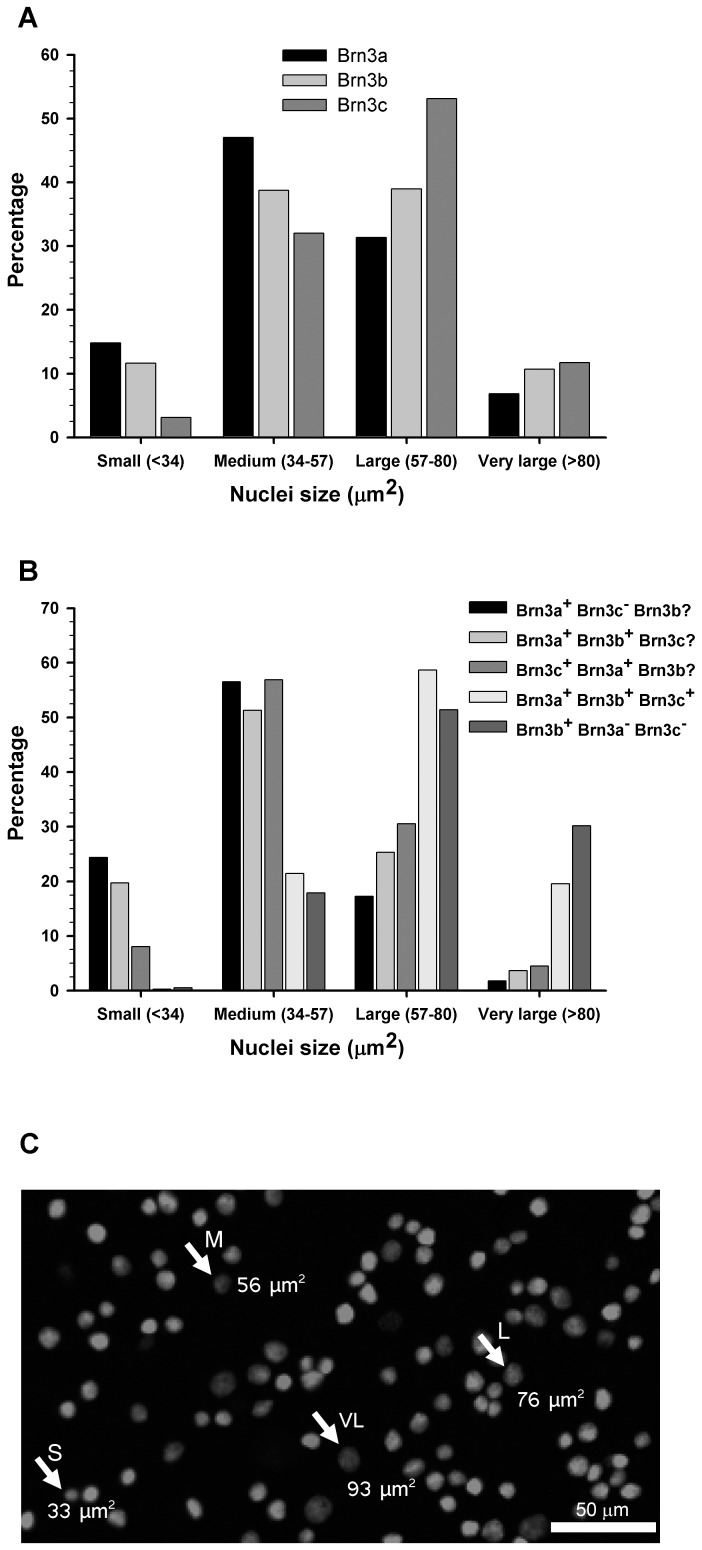
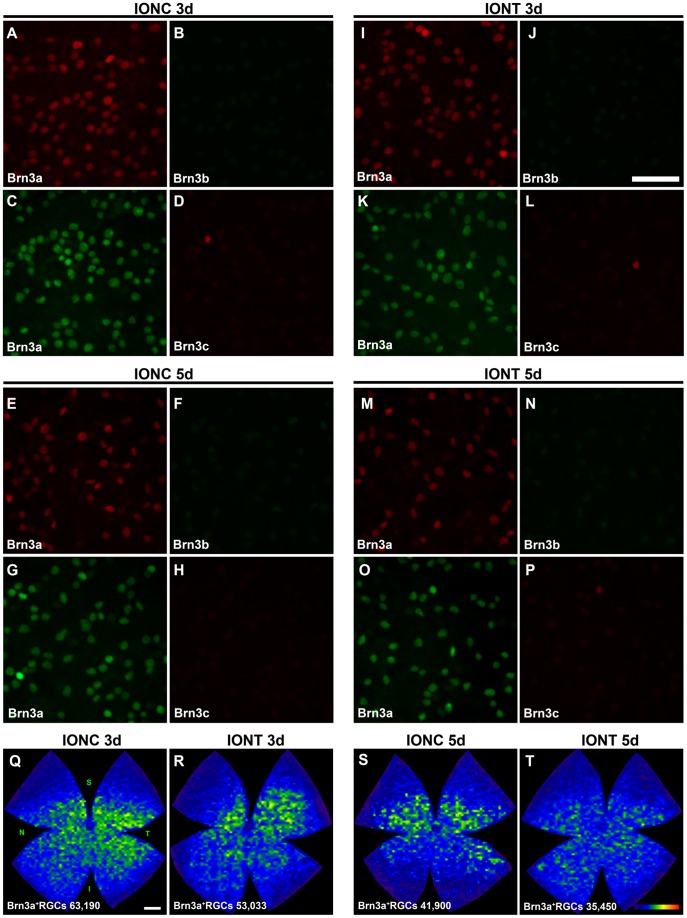
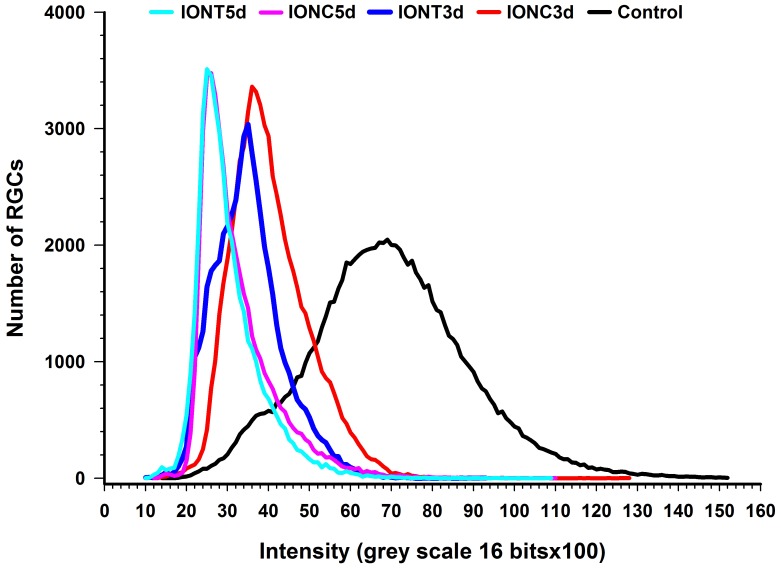
The three members of the Pou4f family of transcription factors: Pou4f1, Pou4f2, Pou4f3 (Brn3a, Brn3b and Brn3c, respectively) play, during development, essential roles in the differentiation and survival of sensory neurons. The purpose of this work is to study the expression of the three Brn3 factors in the albino and pigmented adult rat. Animals were divided into these groups: i) untouched; ii) fluorogold (FG) tracing from both superior colliculli; iii) FG-tracing from one superior colliculus; iv) intraorbital optic nerve transection or crush. All retinas were dissected as flat-mounts and subjected to single, double or triple immunohistofluorescence The total number of FG-traced, Brn3a, Brn3b, Brn3c or Brn3 expressing RGCs was automatically quantified and their spatial distribution assessed using specific routines. Brn3 factors were studied in the general RGC population, and in the intrinsically photosensitive (ip-RGCs) and ipsilateral RGC sub-populations. Our results show that: i) 70% of RGCs co- express two or three Brn3s and the remaining 30% express only Brn3a (26%) or Brn3b; ii) the most abundant Brn3 member is Brn3a followed by Brn3b and finally Brn3c; iii) Brn3 a-, b- or c- expressing RGCs are similarly distributed in the retina; iv) The vast majority of ip-RGCs do not express Brn3; v) The main difference between both rat strains was found in the population of ipsilateral-RGCs, which accounts for 4.2% and 2.5% of the total RGC population in the pigmented and albino strain, respectively. However, more ipsilateral-RGCs express Brn3 factors in the albino than in the pigmented rat; vi) RGCs that express only Brn3b and RGCs that co-express the three Brn3 members have the biggest nuclei; vii) After axonal injury the level of Brn3a expression in the surviving RGCs decreases compared to control retinas. Finally, this work strengthens the validity of Brn3a as a marker to identify and quantify rat RGCs.


Conflict of interest statement

Competing Interests: The authors have declared that no competing interests exist.

Figures

Figure 1
Figure 1. Co-expression of Brn3 transcription factors in albino and pigmented rats. A–O:
Magnifications from SD flat mounted retinas in which FG and Brn3a (A–C); Brn3a detected with two different antibodies -goat and mouse anti-Brn3a-(D–F); Brn3a and b (G–H), Brn3a and c (J–L) and Brn3b and c (M–O) have been double detected. In images like these taken from SD (albino) and PVG (pigmented) rat retinas the percentage of co-localization of each marker (see figure 2) was calculated. P–R: cross-sections from SD rat retinas, in which Brn3a (P), Brn3b (Q) and Brn3c (R) have been detected to show that these proteins are only expressed in the ganglion cell layer. In these images, all nuclei have been counterstained with DAPI. Arrows point to those RGCs that only express one of the Brn3s. Bar: 50 µm (C,R).
Figure 2
Figure 2. Brn3 co-expression in albino and pigmented rat retinas.
A: Stacked-bar graph showing the percentage of Brn3 co-expression in both rat strains. In each bar is shown the number of cells counted. First and second bars: percentage of Brn3b+RGCs that express or not Brn3a. Third and fourth bars: percentage of Brn3c+RGCs that express or not Brn3a. Fifth and sixth bars: percentage of Brn3b+RGCs that express or not Brn3c. Seventh and eighth bars: percentage of Brn3c+RGCs that express or not Brn3b. Percentage was calculated considering 100% the total number of cells per marker (see results for further explanation). B: Inference of the total number of RGCs that express one, two or the three Brn3 members in the albino strain. These numbers were calculated based on the co-expression percentages and on the total number of RGCs (see table 1 and results). The final population for each marker combination is shown in the grey squares.
Figure 3
Figure 3. Expression of Brn3 transcription factors by intrinsically photosensitive RGCs (ip-RGCs).
Magnifications from SD flat mounted retinas in which Brn3a and melanopsin (AC), Brn3b and melanopsin (E–G) and Brn3c and melanopsin (I–J) have been double immunodetected. Arrows point to doubly labelled ip-RGCs. D, H, and L: Quantification of the number of ip-RGCs that express Brn3a, b or c in albino (left) and pigmented (right) rats. In these pies is shown the net number of counted ip-RGCs and the percentage of them that express a given Brn3 member. Bars: 50 µm (K, R). n = 4 retinas per marker and strain.
Figure 4
Figure 4. Spatial distribution of RGCs in albino and pigmented rats.
A–E: magnifications from flat mounted retinas showing RGCs detected by FG tracing (A), Brn3a (B), Brn3b (C), Brn3c (D) and Brn3a+b+c immunodetection. A, B and C, D are images taken from the same retinal frame. In E the three Brn3 members were detected using the same fluorophore (Brn3+RGCs). F–Y: Representative isodensity maps showing the retinal distribution of RGCs in SD (albino) and PVG (pigmented rats). F–I: fluorogold traced RGCs, J–M: Brn3a+RGCs, N–Q: Brn3b+RGCs, R–U: Brn3c+RGCs, V–Y: Brn3+RGCs. For each marker and strain is shown the distribution of RGCs in one left and one right retina. Notice that, because FG and Brn3a or Brn3b and Brn3c were double detected, maps F&J, G&K, H&L, I&M, N&R, O&S, P&T and Q&U come from the same retinas. Isodensity maps are created from the data gathered after automated quantification. At the bottom of each one is shown the number of RGCs counted in the retina wherefrom the map has been generated. These maps express the RGC density according to a colour scale (bottom right in I, M, Q, U and Y) that ranges from 0 RGCs/mm2 (blue) to a maximum density (red) that is 3,200 RGCs/mm2 or more for FG+, Brn3a+and Brn3+RGCs; 1,800 RGCs/mm2 or more for Brn3b+RGCs, and 1,600 RGCs/mm2 or more for Brn3c+RGCs. The maximum density was adjusted to these numbers to allow the visualization of high and low density areas within the retina. Retinal orientation is shown in F–I: superior (S), nasal (N) temporal (T) and inferior (I). Bars: 20 µm (A), 1 mm (F, H).
Figure 5
Figure 5. Distribution of ipsilateral RGCs in albino and pigmented rats.
A, E Photomontages of an albino (A) and a pigmented (E) retina showing RGCs traced from the ipsilateral colliculi (ipsilateral-RGCs). B–D, F–H: retinal silhouettes showing the distribution of Brn3a+ipsilateral-RGCs (B, F), Brn3b+ipsilateral-RGCs (C, D) and Brn3c+ipsilateral-RGCs (D, H) in albino (B–D) and pigmented (F–H) rats. At the bottom of each retina is shown its number of ipsilateral-RGCs (in brackets). I: Histogram showing the percentage of Brn3a, Brn3b and Brn3c positive ipsilateral-RGCs with respect to their total number. J–L: Magnifications from the inferotemporal quadrant of ipsilaterally-traced retinas showing ipsilateral-RGCs and Brn3a (J), Brn3b (K) and Brn3c (L) RGCs. Arrows point to ipsilateral-RGCs that are Brn3 positive. Retinal orientation is shown in A: superior (S), nasal (N) temporal (T) and inferior (I). Bars: 1 mm (A,E), 50 µm (J).
Figure 6
Figure 6. RGC nuclear sizes and expression of Brn3 factors.
A: Histogram showing the percentages of Brn3a, Brn3b or Brn3c positive nuclei that are small, medium, large or very large. B: Histogram showing for each Brn3 combination the percentage of small, medium, large and very large nuclei (each Brn3 combination was considered 100%). C: Brn3a immunodetection showing the different sizes of RGC nuclei. An example of each size range is shown (S: small, M: medium, L: large, VL: very large).
Figure 7
Figure 7. Brn3b and Brn3c expression is rapidly lost after optic nerve injury.
A-P: Magnifications from SD flat mounted retinas analyzed 3 and 5 days after intraorbital nerve crush (A–H) and intraorbital nerve transection (J–P). As internal control, Brn3a was double immunodetected with Brn3b (A–B, E–F, I–J, M–N) or with Brn3c (C–D, G–H, K–L, O–P). In these images is observed that Brn3b and Brn3c expression decreases already 3 days after both injuries. This low signal impeded the automated quantification of Brn3b and Brn3c positive RGCs. Brn3a+RGCs were counted in these retinas and isodensity maps showing the distribution of the surviving RGCs were created (Q–T, at the bottom of each map is shown the number of Brn3a+RGCs counted in the retina wherefrom the map has been generated). These maps illustrate that IONT induces a quicker loss of RGCs than IONC, as evidenced by the higher densities observed in Q and S than in R and T. Colour scale (T bottom right) is the same as in figure 4M. Four (IONC 5d) or five (rest of the groups) retinas were analyzed per marker. Bars: 50 µm (J), 1 mm (Q).
Figure 8
Figure 8. Injured RGCs down-regulate Brn3a expression.
Plot depicting the distribution of RGCs according to their expression level of Brn3a. The number of RGCs (ordinate axis) is plotted against the intensity of their Brn3a signal in control, IONC and IONT injured retinas at 3 and 5 days post-lesion.

Similar articles

Cited by

References

    1. Ninkina NN, Stevens GE, Wood JN, Richardson WD (1993) A novel Brn3-like POU transcription factor expressed in subsets of rat sensory and spinal cord neurons. Nucleic Acids Res 21: 3175–3182. - PMC - PubMed
    1. Lillycrop KA, Budrahan VS, Lakin ND, Terrenghi G, Wood JN, et al. (1992) A novel POU family transcription factor is closely related to Brn-3 but has a distinct expression pattern in neuronal cells. Nucleic Acids Res 20: 5093–5096. - PMC - PubMed
    1. He X, Treacy MN, Simmons DM, Ingraham HA, Swanson LW, et al. (1989) Expression of a large family of POU-domain regulatory genes in mammalian brain development. Nature 340: 35–41. - PubMed
    1. Badea TC, Williams J, Smallwood P, Shi M, Motajo O, et al. (2012) Combinatorial expression of Brn3 transcription factors in somatosensory neurons: genetic and morphologic analysis. J Neurosci 32: 995–1007. - PMC - PubMed
    1. Xiang M, Zhou L, Macke JP, Yoshioka T, Hendry SH, et al. (1995) The Brn-3 family of POU-domain factors: primary structure, binding specificity, and expression in subsets of retinal ganglion cells and somatosensory neurons. J Neurosci 15: 4762–4785. - PMC - PubMed

Publication types

MeSH terms

Substances