

Helicobacter pylori colonization ameliorates glucose homeostasis in mice through a PPAR γ-dependent mechanism
- PMID: 23166823
- PMCID: PMC3499487
- DOI: 10.1371/journal.pone.0050069
Helicobacter pylori colonization ameliorates glucose homeostasis in mice through a PPAR γ-dependent mechanism
Abstract
Background: There is an inverse secular trend between the incidence of obesity and gastric colonization with Helicobacter pylori, a bacterium that can affect the secretion of gastric hormones that relate to energy homeostasis. H. pylori strains that carry the cag pathogenicity island (PAI) interact more intimately with gastric epithelial cells and trigger more extensive host responses than cag(-) strains. We hypothesized that gastric colonization with H. pylori strains differing in cag PAI status exert distinct effects on metabolic and inflammatory phenotypes.
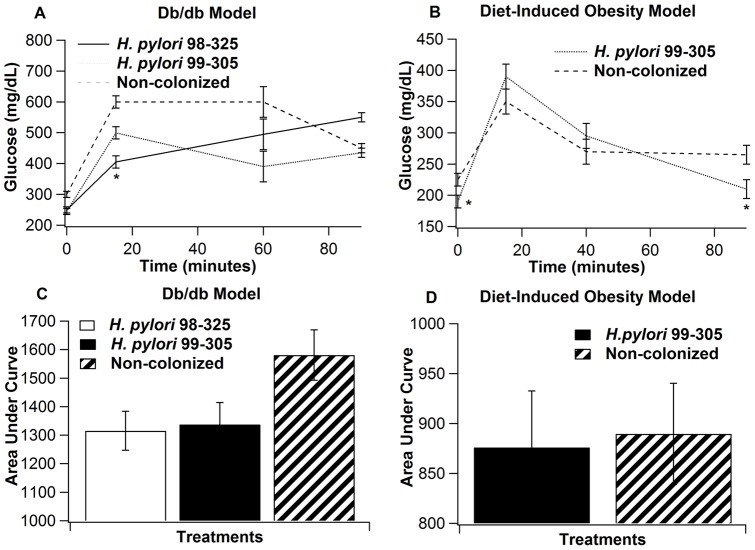
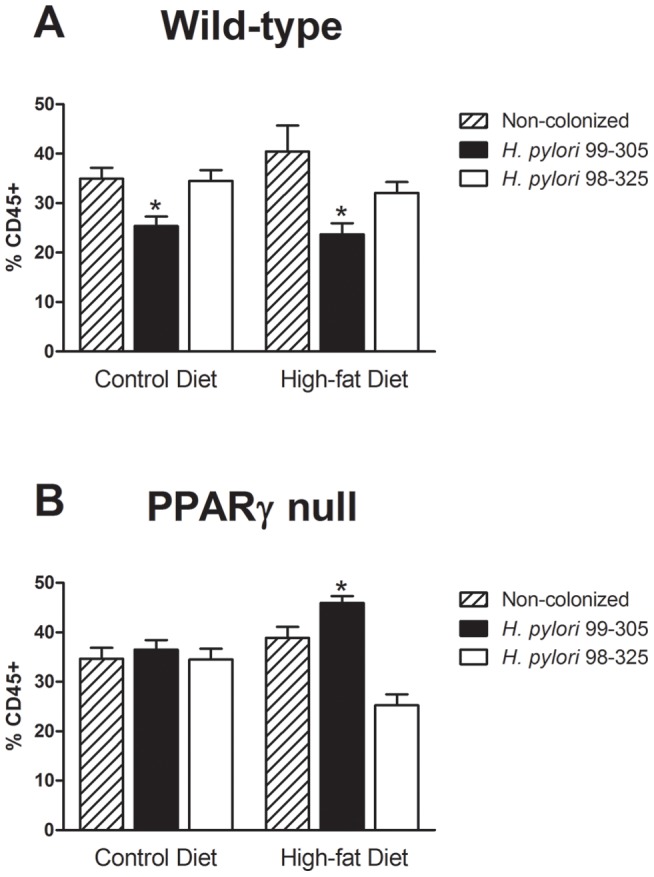
Methodology/principal findings: To test this hypothesis, we examined metabolic and inflammatory markers in db/db mice and mice with diet-induced obesity experimentally infected with isogenic forms of H. pylori strain 26695: the cag PAI wild-type and its cag PAI mutant strain 99-305. H. pylori colonization decreased fasting blood glucose levels, increased levels of leptin, improved glucose tolerance, and suppressed weight gain. A response found in both wild-type and mutant H. pylori strain-infected mice included decreased white adipose tissue macrophages (ATM) and increased adipose tissue regulatory T cells (Treg) cells. Gene expression analyses demonstrated upregulation of gastric PPAR γ-responsive genes (i.e., CD36 and FABP4) in H. pylori-infected mice. The loss of PPAR γ in immune and epithelial cells in mice impaired the ability of H. pylori to favorably modulate glucose homeostasis and ATM infiltration during high fat feeding.
Conclusions/significance: Gastric infection with some commensal strains of H. pylori ameliorates glucose homeostasis in mice through a PPAR γ-dependent mechanism and modulates macrophage and Treg cell infiltration into the abdominal white adipose tissue.
Conflict of interest statement
Figures


Similar articles
-
Helicobacter pylori cag pathogenicity island's role in B7-H1 induction and immune evasion.PLoS One. 2015 Mar 25;10(3):e0121841. doi: 10.1371/journal.pone.0121841. eCollection 2015. PLoS One. 2015. PMID: 25807464 Free PMC article.
-
Regulation of the Helicobacter pylori cellular receptor decay-accelerating factor.J Biol Chem. 2008 Aug 29;283(35):23922-30. doi: 10.1074/jbc.M801144200. Epub 2008 Jun 25. J Biol Chem. 2008. PMID: 18579524 Free PMC article.
-
The effect of the cag pathogenicity island on binding of Helicobacter pylori to gastric epithelial cells and the subsequent induction of apoptosis.Helicobacter. 2007 Dec;12(6):583-90. doi: 10.1111/j.1523-5378.2007.00537.x. Helicobacter. 2007. PMID: 18001397 Free PMC article.
-
Pathogenicity island-dependent effects of Helicobacter pylori on intracellular signal transduction in epithelial cells.Int J Med Microbiol. 2005 Sep;295(5):335-41. doi: 10.1016/j.ijmm.2005.06.007. Int J Med Microbiol. 2005. PMID: 16173500 Review.
-
Influence of Helicobacter pylori on gastric regulation of food intake.Curr Opin Clin Nutr Metab Care. 2009 Sep;12(5):522-5. doi: 10.1097/MCO.0b013e32832eb56e. Curr Opin Clin Nutr Metab Care. 2009. PMID: 19584718 Review.
Cited by
-
Helicobacter pylori infection in a pig model is dominated by Th1 and cytotoxic CD8+ T cell responses.Infect Immun. 2013 Oct;81(10):3803-13. doi: 10.1128/IAI.00660-13. Epub 2013 Jul 29. Infect Immun. 2013. PMID: 23897614 Free PMC article.
-
Predictive computational modeling of the mucosal immune responses during Helicobacter pylori infection.PLoS One. 2013 Sep 5;8(9):e73365. doi: 10.1371/journal.pone.0073365. eCollection 2013. PLoS One. 2013. PMID: 24039925 Free PMC article.
-
Tissue Tregs.Annu Rev Immunol. 2016 May 20;34:609-33. doi: 10.1146/annurev-immunol-032712-095948. Annu Rev Immunol. 2016. PMID: 27168246 Free PMC article. Review.
-
Cooperation of Gastric Mononuclear Phagocytes with Helicobacter pylori during Colonization.J Immunol. 2017 Apr 15;198(8):3195-3204. doi: 10.4049/jimmunol.1601902. Epub 2017 Mar 6. J Immunol. 2017. PMID: 28264969 Free PMC article.
-
Commensal Streptococcus salivarius Modulates PPARγ Transcriptional Activity in Human Intestinal Epithelial Cells.PLoS One. 2015 May 6;10(5):e0125371. doi: 10.1371/journal.pone.0125371. eCollection 2015. PLoS One. 2015. PMID: 25946041 Free PMC article.
References
-
- Blaser MJ (2008) Disappearing microbiota: Helicobacter pylori protection against esophageal adenocarcinoma. Cancer Prev Res (Phila Pa) 1: 308–311. - PubMed
-
- Danesh J (1999) Helicobacter pylori infection and gastric cancer: systematic review of the epidemiological studies. Aliment Pharmacol Ther 13: 851–856. - PubMed
Publication types
MeSH terms
Substances
Grants and funding
LinkOut - more resources
Full Text Sources
Medical
Research Materials
Miscellaneous
