. 2012;7(11):e50131.
doi: 10.1371/journal.pone.0050131. Epub 2012 Nov 16.

Early metabolic defects in dexamethasone-exposed and undernourished intrauterine growth restricted rats

Affiliations

Early metabolic defects in dexamethasone-exposed and undernourished intrauterine growth restricted rats

Emmanuel Somm et al. PLoS One. 2012.

Abstract

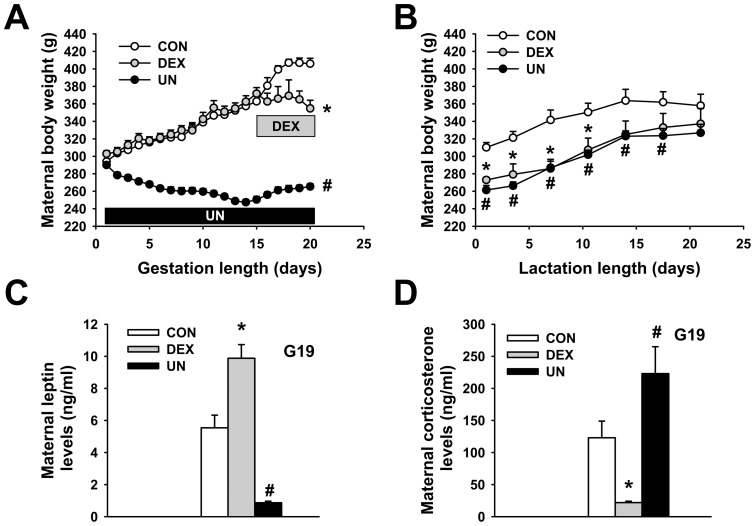
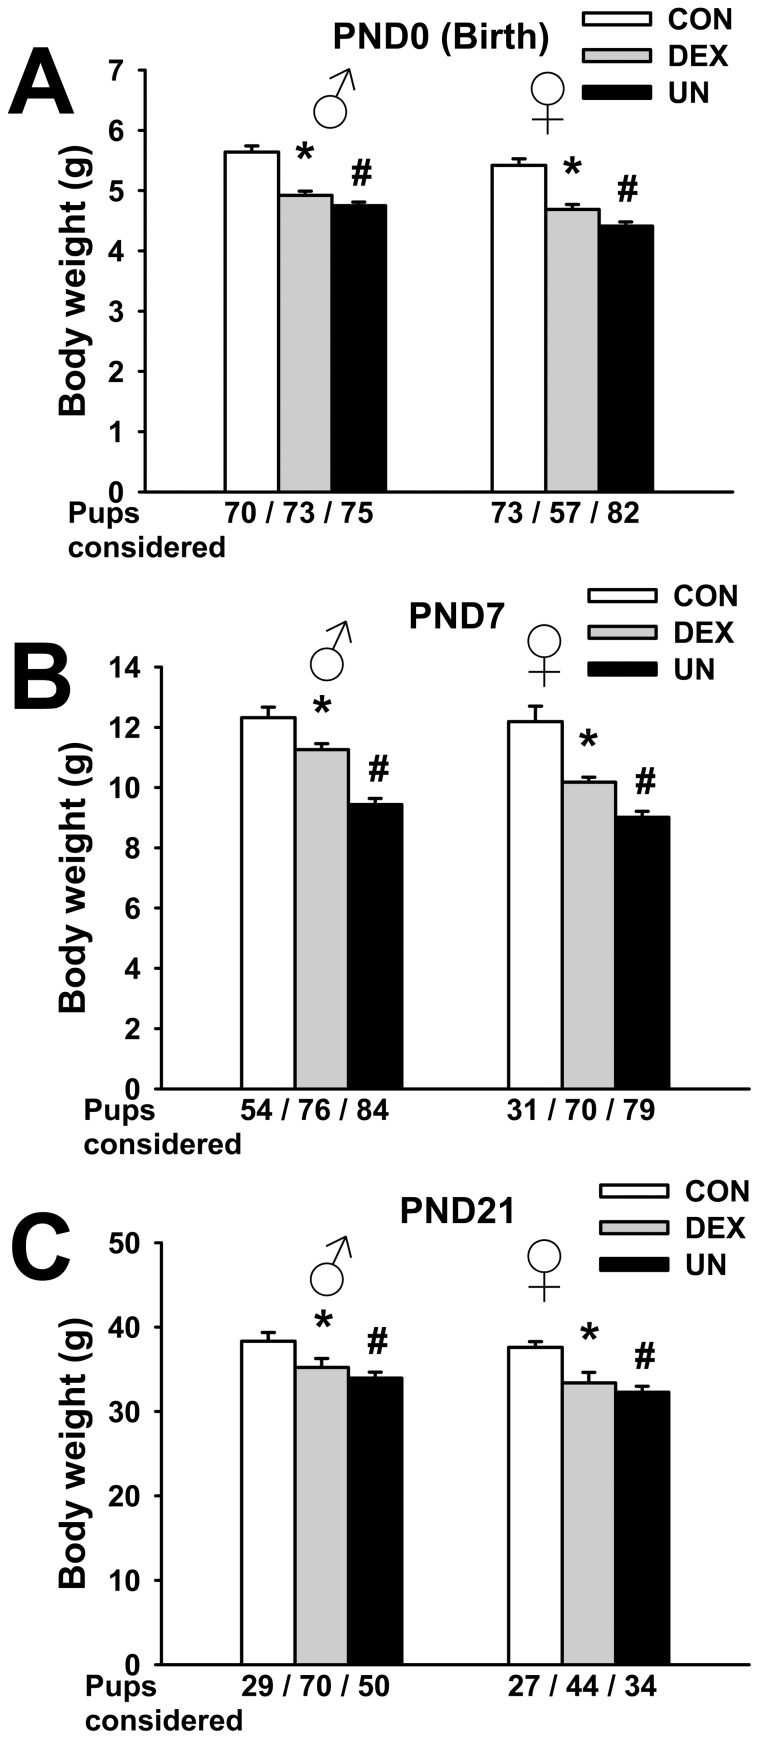
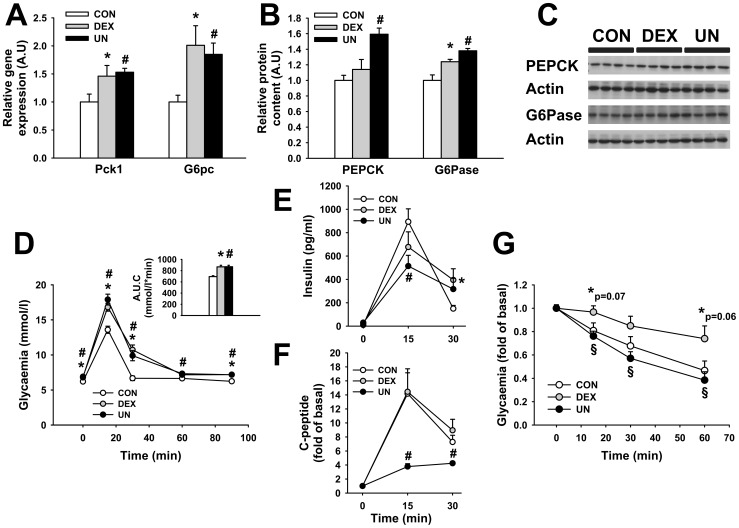
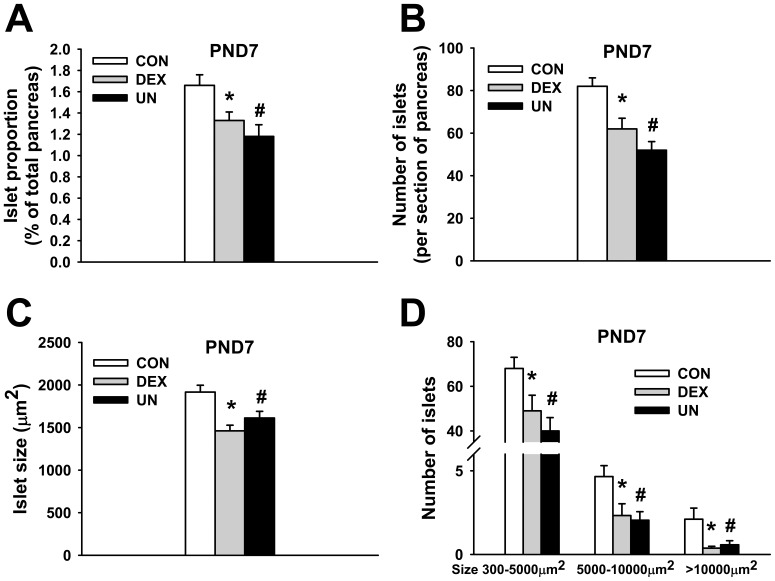
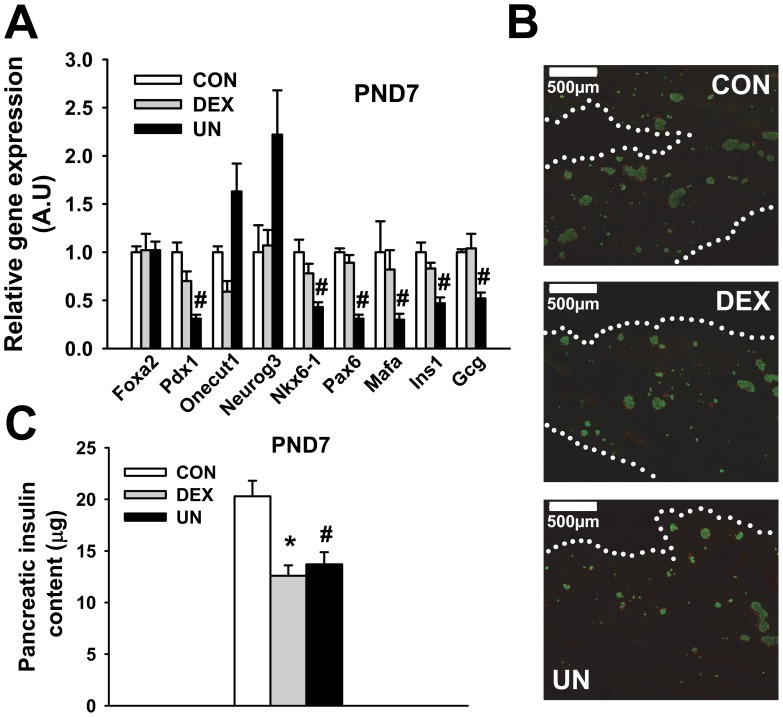
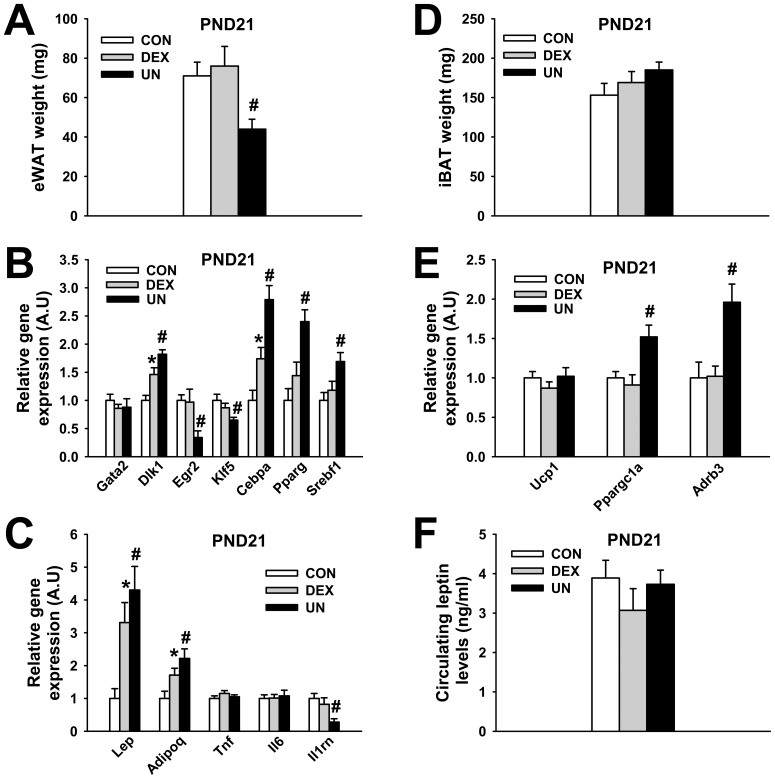
Poor fetal growth, also known as intrauterine growth restriction (IUGR), is a worldwide health concern. IUGR is commonly associated with both an increased risk in perinatal mortality and a higher prevalence of developing chronic metabolic diseases later in life. Obesity, type 2 diabetes or metabolic syndrome could result from noxious "metabolic programming." In order to better understand early alterations involved in metabolic programming, we modeled IUGR rat pups through either prenatal exposure to synthetic glucocorticoid (dams infused with dexamethasone 100 µg/kg/day, DEX) or prenatal undernutrition (dams feeding restricted to 30% of ad libitum intake, UN). Physiological (glucose and insulin tolerance), morphometric (automated tissue image analysis) and transcriptomic (quantitative PCR) approaches were combined during early life of these IUGR pups with a special focus on their endocrine pancreas and adipose tissue development. In the absence of catch-up growth before weaning, DEX and UN IUGR pups both presented basal hyperglycaemia, decreased glucose tolerance, and pancreatic islet atrophy. Other early metabolic defects were model-specific: DEX pups presented decreased insulin sensitivity whereas UN pups exhibited lowered glucose-induced insulin secretion and more marked alterations in gene expression of pancreatic islet and adipose tissue development regulators. In conclusion, these results show that before any catch-up growth, IUGR rats present early physiologic, morphologic and transcriptomic defects, which can be considered as initial mechanistic basis of metabolic programming.


Conflict of interest statement

Competing Interests: The authors have declared that no competing interests exist.

Figures

Figure 1
Figure 1. The effects of dexamethasone exposure and undernutrition on prenatal and postnatal maternal weight.
Body weight curve during gestation (A) and post-delivery during lactation (B), circulating leptin levels (C) and circulating corticosterone levels (D) of control dams (CON), dexamethasone-exposed dams (DEX) and undernourrished dams (UN). Circulating leptin and corticosterone levels were measured at gestational day 19 (G19). N = 12–15 gestating rats per group, * p≤0.05 for DEX vs. CON group and # p≤0.05 for UN vs. CON group for panel A. N = 5 gestating rats per group, * p≤0.05 for DEX vs. CON group and # p≤0.05 for UN vs. CON group for panel B. N = 5 gestating rats per group, * p≤0.01 for DEX vs. CON group and # p≤0.002 for UN vs. CON group for panel C. N = 7–9 gestating rats per group, * p≤0.001 for DEX vs. CON group and # p≤0.05 for UN vs. CON group for panel D.
Figure 2
Figure 2. Postnatal body weight in IUGR pups.
Body weight at birth (postnatal day 0, PND0) (A), at PND7 (B) and at PND21 (C) of male and female control pups (CON), prenatally dexamethasone-exposed pups (DEX) and prenatally undernourrished pups (UN). Number of pups considered is indicated below each corresponding bar. * p≤0.0001 for DEX vs. CON group and # p≤0.0001 for UN vs. CON group (panel A), * p≤0.005 for DEX vs. CON group and # p≤0.0001 for UN vs. CON group (panel B), * p≤0.01 for DEX vs. CON group and # p≤0.001 for UN vs. CON group (panel C).
Figure 3
Figure 3. Glucose homeostasis in IUGR pups.
Phosphoenolpyruvate carboxykinase (Pck1) and glucose-6-phosphatase (G6pc) mRNA (A) and protein (B and C) levels in liver at PND7, circulating glucose (D), insulin (E) and C-peptide (F) levels during a GTT at PND21, relative glycaemia during an ITT at PND28 (G) of male control pups (CON), prenatally dexamethasone-exposed pups (DEX) and prenatally undernourrished pups (UN). N = 6 male rats per group for panel A, N = 4 male rats per group for panel B and C, N = 12–15 male rats per group for panel D and G, N = 10–12 male rats per group for panel E and F. For all panel, * p≤0.05 or indicated value for DEX vs. CON group, # p≤0.05 for UN vs. CON group and § p≤0.05 for DEX vs. UN group.
Figure 4
Figure 4. Morphological analysis of endocrine pancreas in IUGR pups.
Islet area reported to whole pancreas area (A), number of islets per section (B), mean islet size expressed in µm2 (C) and number of small (300–5000µm2), medium (5000–10000µm2) and large (>10000µm2) islets per section (D) of male control pups (CON), prenatally dexamethasone-exposed pups (DEX) and prenatally undernourrished pups (UN). For all panel, N = 5–6 male rats per group, 3 pancreatic sections per rat, * p≤0.02 for DEX vs. CON group, # p≤0.005 for UN vs. CON group (A), * p≤0.005 for DEX vs. CON group, # p≤0.001 for UN vs. CON group (B), * p≤0.0001 for DEX vs. CON group, # p≤0.01 for UN vs. CON group (C), * p≤0.05 for DEX vs. CON group, # p≤0.05 for UN vs. CON group (D).
Figure 5
Figure 5. Endocrine pancreas hormone production in IUGR pups.
mRNA levels of transcription factors and hormones in pancreatic islets (A), pancreatic immunolabelling of insulin (green) and glucagon (red) (B), pancreatic insulin content (C) of male control pups (CON), prenatally dexamethasone-exposed pups (DEX) and prenatally undernourrished pups (UN) at PND7. N = 3–8 pools of 3 male rats per group (panel A), N = 5–6 male rats per group (panel C). * p≤0.05 for DEX vs. CON group, # p≤0.05 for UN vs. CON group for all panels. Dotted white lines indicate the delimitation of the pancreatic tissue in panel B. Note the lower density and reduced size of islets from DEX and UN pups in panel B.
Figure 6
Figure 6. Adipose tissue deposition and transcriptional changes in IUGR pups at weaning.
Weight of epididymal white adipose tissue (eWAT) (A), mRNA levels of transcription factors in eWAT (B), mRNA levels of adipokines in eWAT (C), weight of interscapular brown adipose tissue (iBAT) (D), mRNA levels of markers in iBAT (E), circulating leptin levels (F) in male control pups (CON), prenatally dexamethasone-exposed pups (DEX) and prenatally undernourrished pups (UN) at PND21. N = 10 (panel A–E), N = 5 (panel F) male rats per group, * p≤0.05 for DEX vs. CON group, # p≤0.05 for UN vs. CON group for all panels.

Similar articles

Cited by

References

    1. Hales CN, Barker DJ, Clark PM, Cox LJ, Fall C, et al. (1991) Fetal and infant growth and impaired glucose tolerance at age 64. BMJ 303: 1019–1022. - PMC - PubMed
    1. Vuguin P, Raab E, Liu B, Barzilai N, Simmons R (2004) Hepatic insulin resistance precedes the development of diabetes in a model of intrauterine growth retardation. Diabetes 53: 2617–2622. - PubMed
    1. Tapanainen PJ, Bang P, Wilson K, Unterman TG, Vreman HJ, et al. (1994) Maternal hypoxia as a model for intrauterine growth retardation: effects on insulin-like growth factors and their binding proteins. Pediatr Res 36: 152–158. - PubMed
    1. Eriksson UJ, Jansson L (1984) Diabetes in pregnancy: decreased placental blood flow and disturbed fetal development in the rat. Pediatr Res 18: 735–738. - PubMed
    1. Jimenez-Chillaron JC, Hernandez-Valencia M, Reamer C, Fisher S, Joszi A, et al. (2005) Beta-cell secretory dysfunction in the pathogenesis of low birth weight-associated diabetes: a murine model. Diabetes 54: 702–711. - PubMed

Publication types

MeSH terms