. 2012;7(11):e50160.
doi: 10.1371/journal.pone.0050160. Epub 2012 Nov 16.

Acetaminophen induces human neuroblastoma cell death through NFKB activation

Affiliations

Acetaminophen induces human neuroblastoma cell death through NFKB activation

Inmaculada Posadas et al. PLoS One. 2012.

Abstract

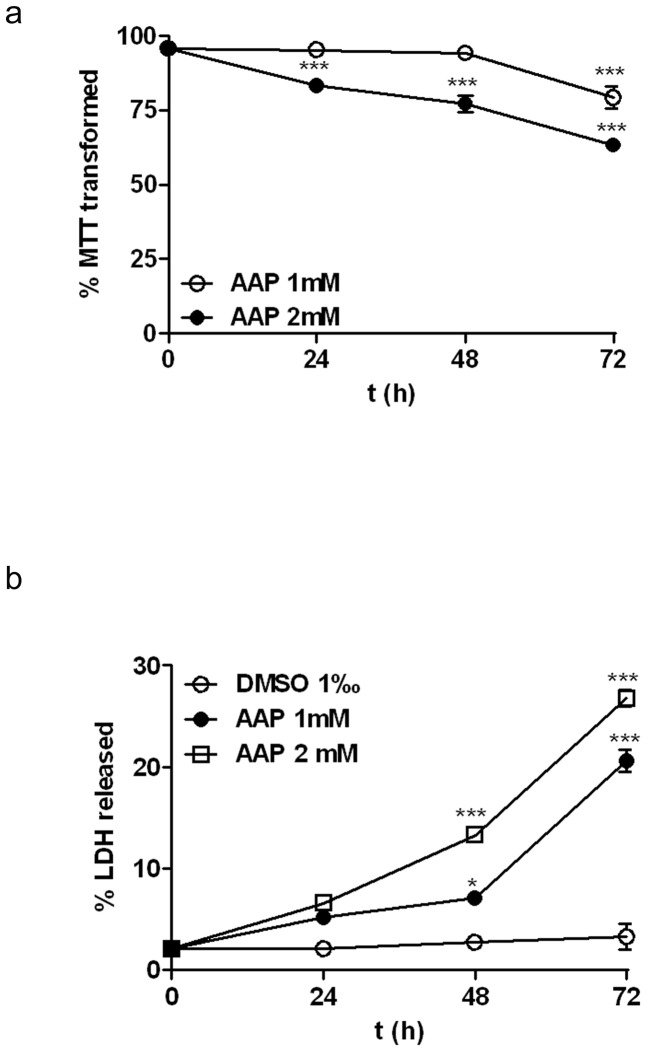
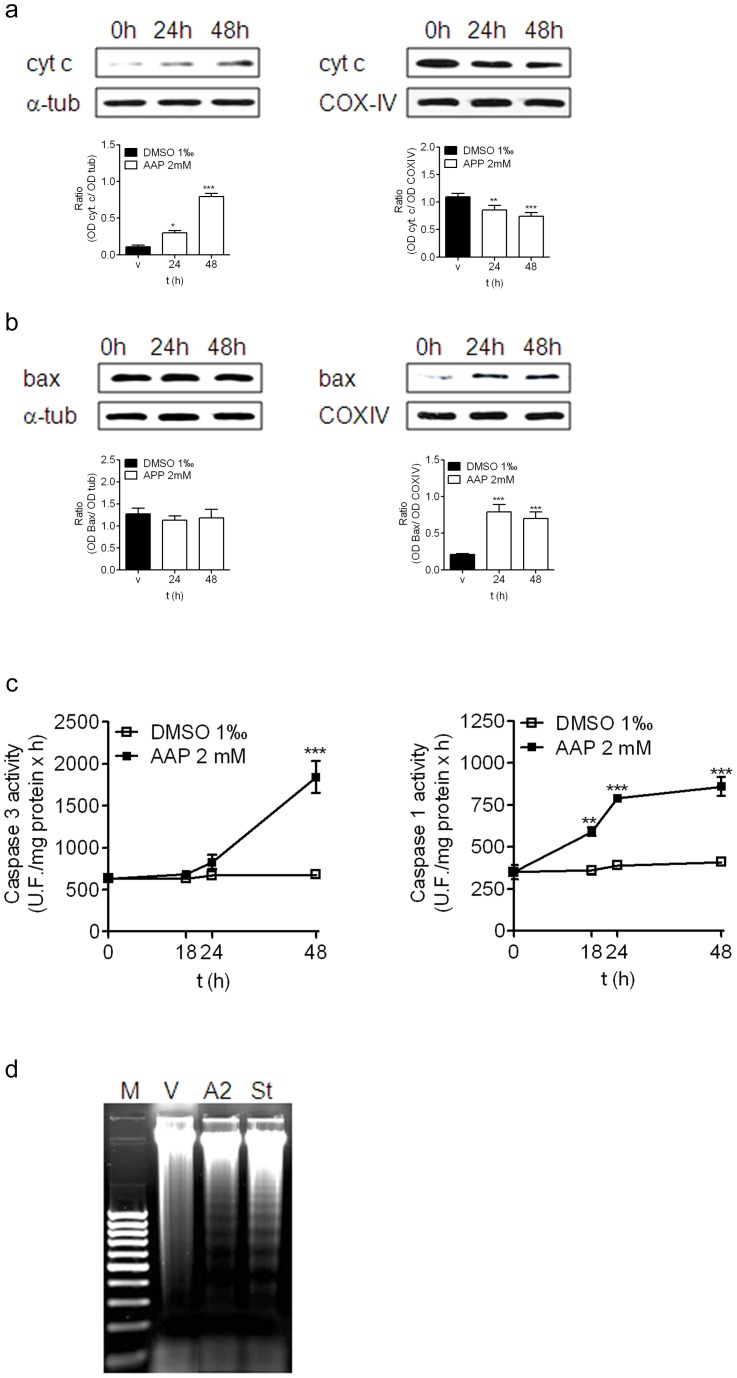
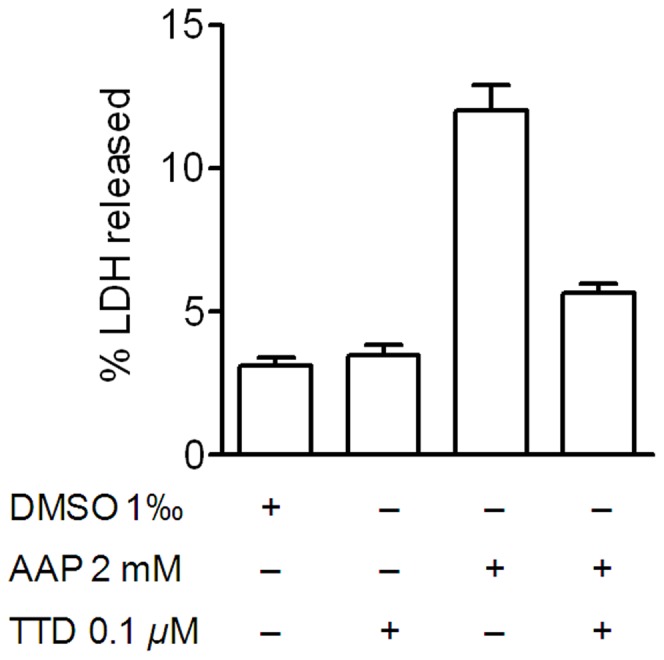
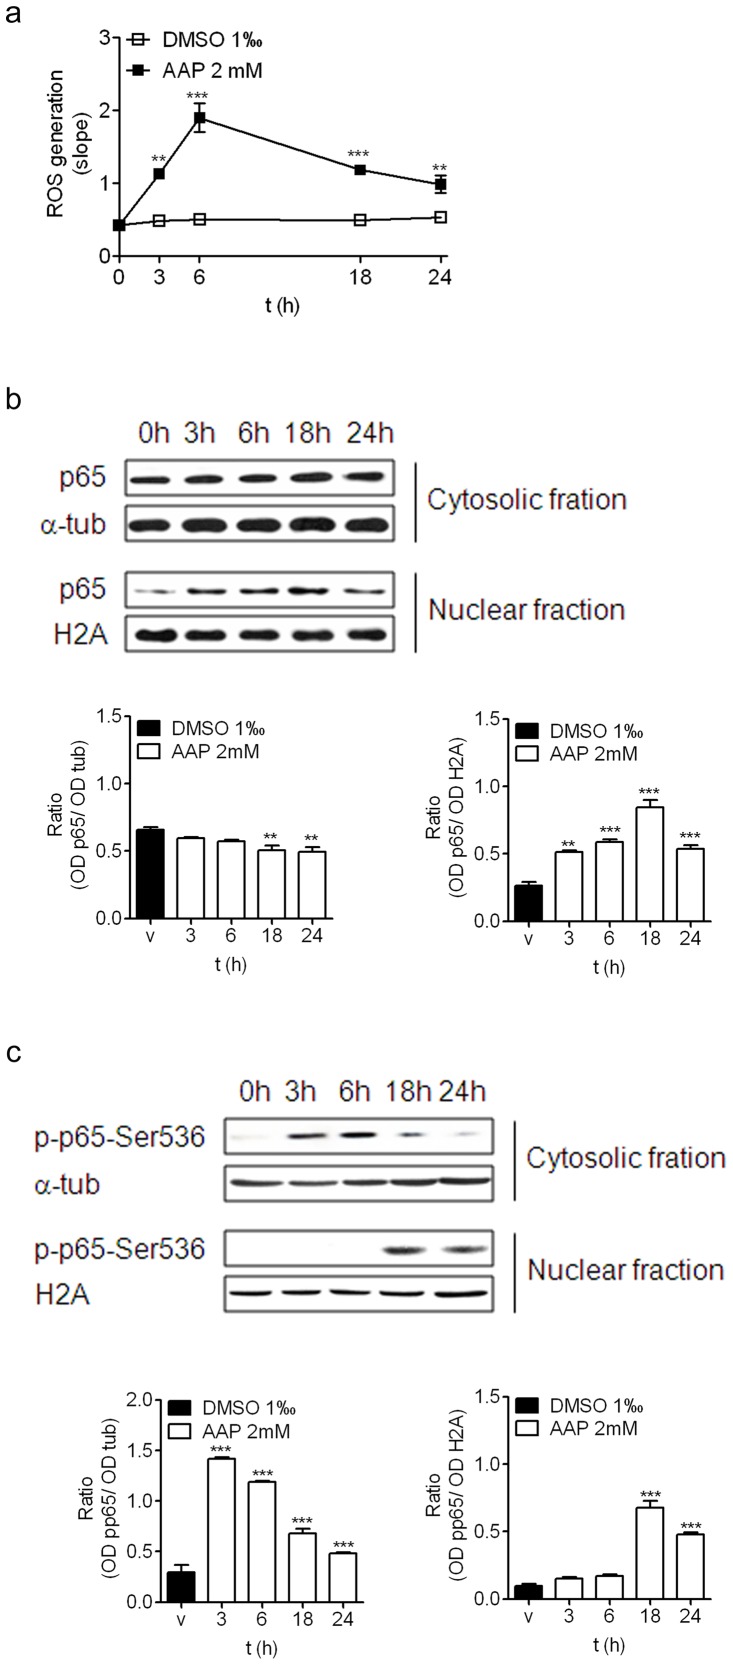
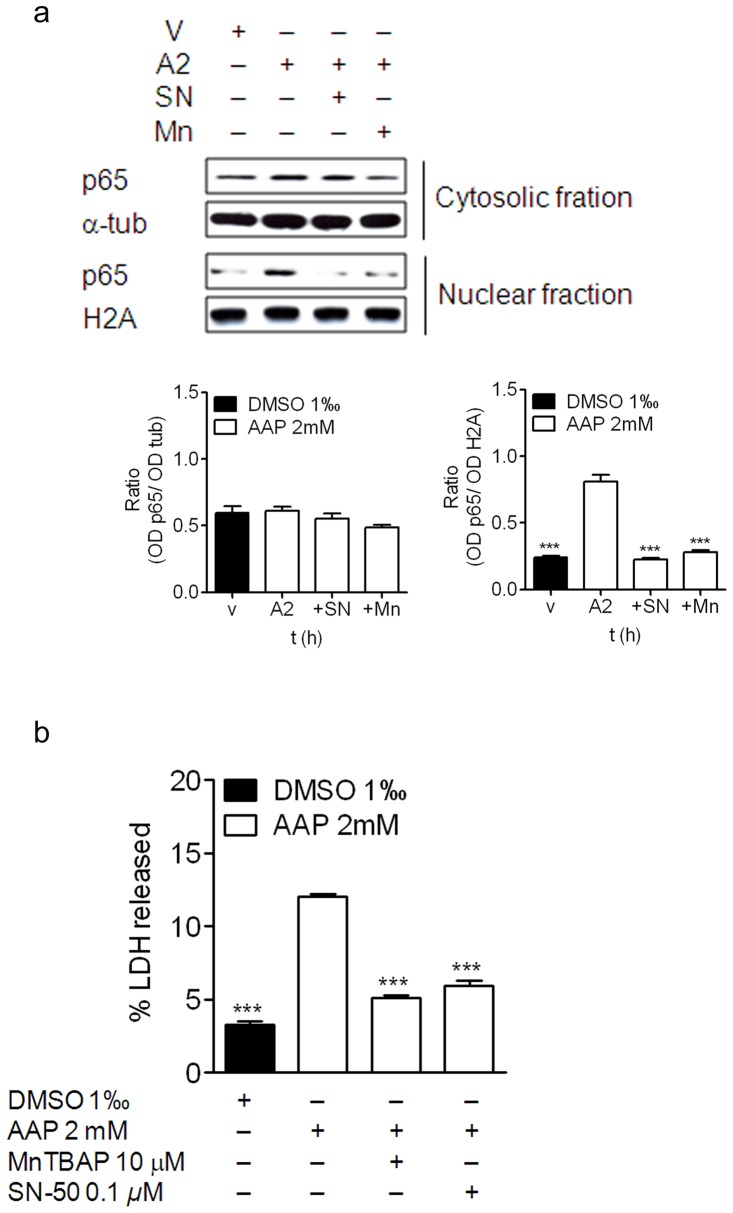
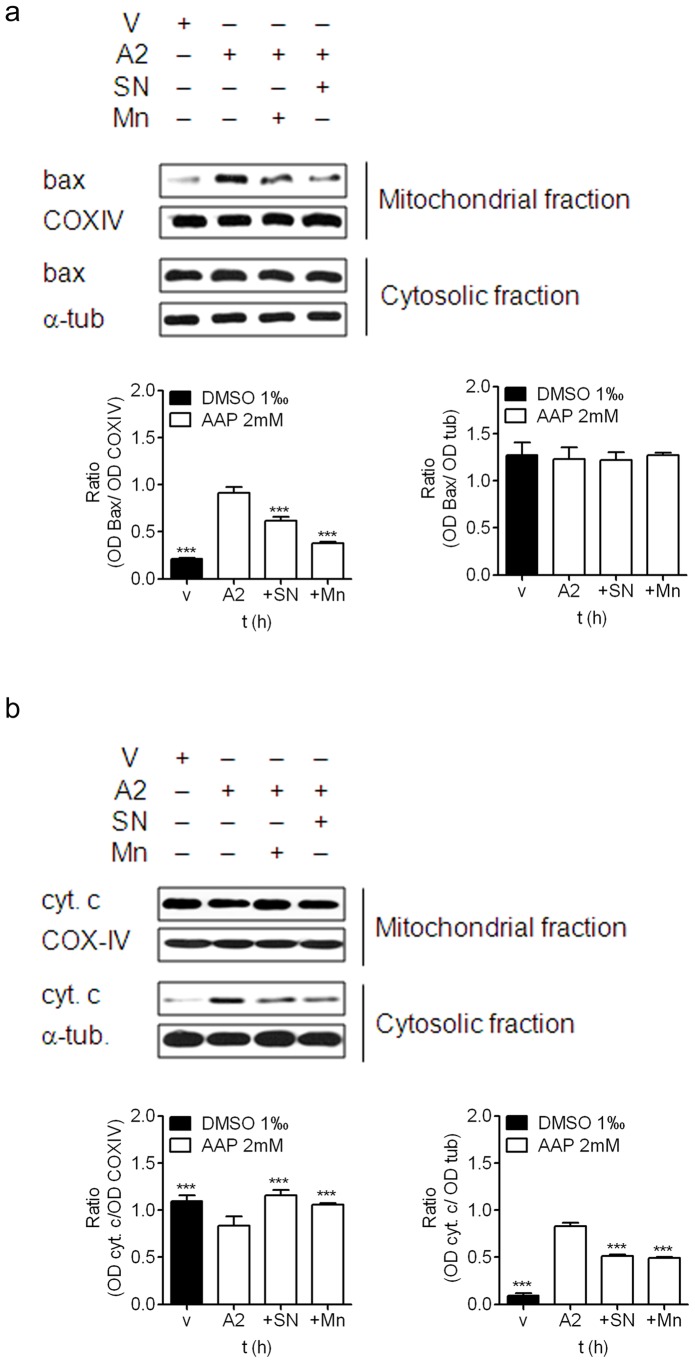
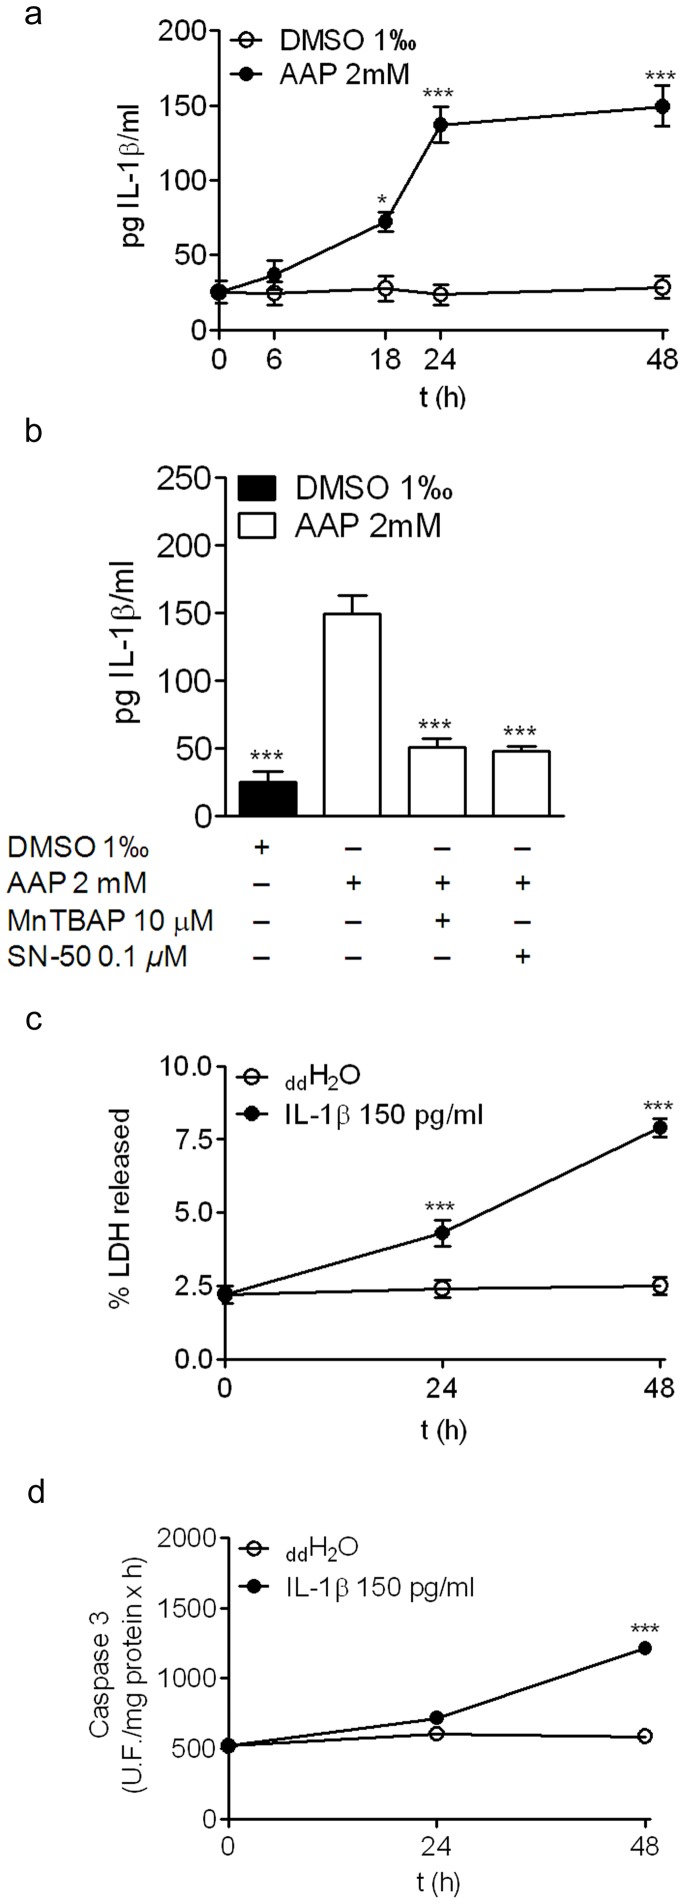
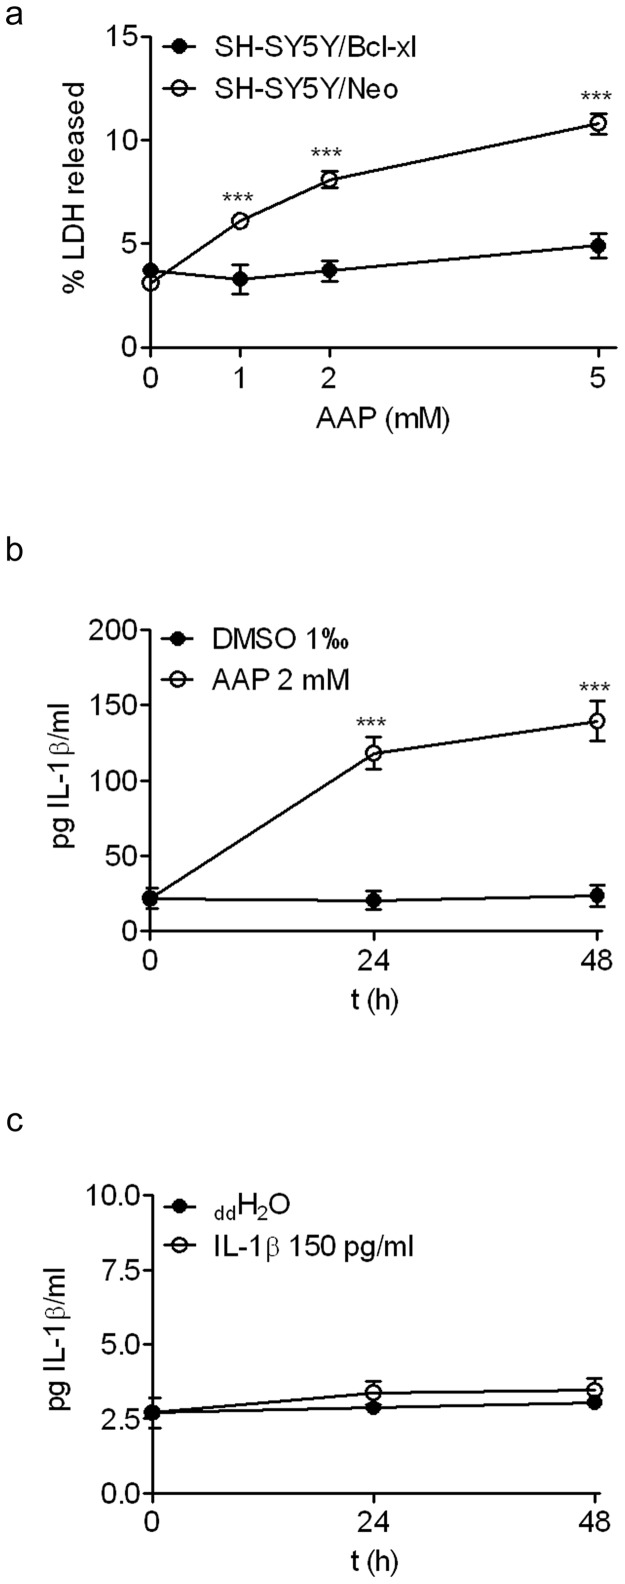
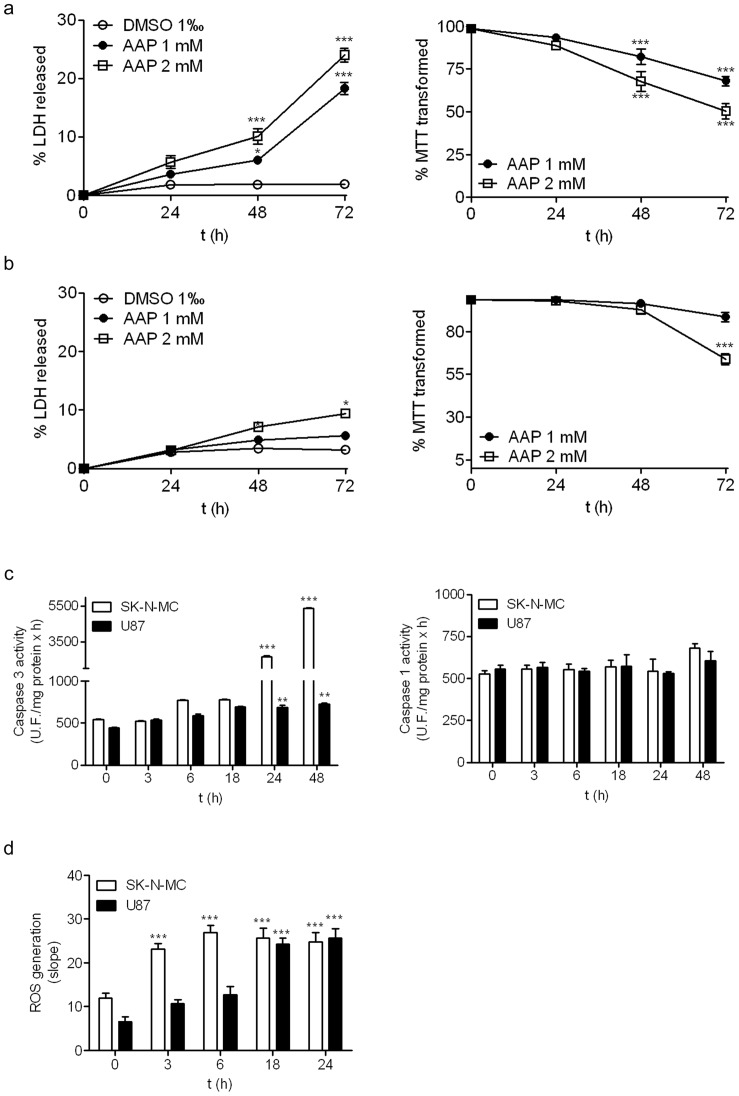
Neuroblastoma resistance to apoptosis may contribute to the aggressive behavior of this tumor. Therefore, it would be relevant to activate endogenous cellular death mechanisms as a way to improve neuroblastoma therapy. We used the neuroblastoma SH-SY5Y cell line as a model to study the mechanisms involved in acetaminophen (AAP)-mediated toxicity by measuring CYP2E1 enzymatic activity, NFkB p65 subunit activation and translocation to the nucleus, Bax accumulation into the mitochondria, cytochrome c release and caspase activation. AAP activates the intrinsic death pathway in the SH-SY5Y human neuroblastoma cell line. AAP metabolism is partially responsible for this activation, because blockade of the cytochrome CYP2E1 significantly reduced but did not totally prevent, AAP-induced SH-SY5Y cell death. AAP also induced NFkB p65 activation by phosphorylation and its translocation to the nucleus, where NFkB p65 increased IL-1β production. This increase contributed to neuroblastoma cell death through a mechanism involving Bax accumulation into the mitochondria, cytochrome c release and caspase3 activation. Blockade of NFkB translocation to the nucleus by the peptide SN50 prevented AAP-mediated cell death and IL-1β production. Moreover, overexpression of the antiapoptotic protein Bcl-x(L) did not decrease AAP-mediated IL-1β production, but prevented both AAP and IL-1β-mediated cell death. We also confirmed the AAP toxic actions on SK-N-MC neuroepithelioma and U87MG glioblastoma cell lines. The results presented here suggest that AAP activates the intrinsic death pathway in neuroblastoma cells through a mechanism involving NFkB and IL-1β.


Conflict of interest statement

Competing Interests: One of the co-authors of the manuscript, Dr. Valentin Ceña, is a PLOS ONE Editorial Board member. This does not alter the authors' adherence to all the PLOS ONE policies on sharing data and materials.

Figures

Figure 1
Figure 1. Effect of acetaminophen (AAP) on SH-SY5Y neuroblastoma cell line viability.
(a) Cells were incubated in the presence of AAP at different concentrations for 24, 48 and 72 h and the percentage of MTT transformed was quantified as an index of mitochondrial function impairment. (b) Cells were incubated in the presence of AAP at different concentrations for 24, 48 and 72 h and the percentage of LDH released to culture media was quantified as an index of cell death. Data are expressed as mean ± SEM of 4 independent experiments carried in triplicate. *p<0.05, **p<0.01, ***p<0.001 as compared to vehicle-treated cells.
Figure 2
Figure 2. AAP-induced SH-SY5Y cell death.
(a) Cytochrome c (cyt. c) release from cytosolic (left) to mitochondrial (right) fraction at 24 and 48 h after AAP (2 mM) treatment. Densitometric analysis of cyt c in the cytosolic (left) and mitochondrial (right) fractions are represented in the lower panels. α-tubulin and COX-IV protein levels were used as cytosolic and mitochondria protein loading controls respectively. The figure is representative of three independent experiments. (b) Bax translocation from cytosolic (left) to mitochondrial (right) fraction at 24 and 48 h after AAP (2 mM) treatment. Densitometric analysis of Bax in the cytosolic (left) and mitochondrial (right) fractions are represented in the lower panels. α-tubulin and COX-IV protein levels were used as cytosolic and mitochondria protein loading controls respectively. The figure is representative of three independent experiments. (c) Caspase 3 activity (left panel) and caspase 1 activity (right panel) measured in total lysates obtained from vehicle (DMSO)- or AAP-treated cells at 18, 24 and 48 hours after treatment. Data are expressed as mean ± s.e.m of 4 independent experiments carried in triplicate. *p<0.05, **p<0.01, ***p<0.001 as compared to vehicle-treated cells. (d) Interrnucleosomal DNA fragmentation in AAP (2 mM; A2)- or staurosporine (500 nM; St)-treated SH-SY5Y cells for 48 h. V stands for untreated cells and M indicates DNA size markers. Nucleosomal fragmentation was visualized by agarose gel electrophoresis under UV light. Figure is representative of 3 independent experiments.
Figure 3
Figure 3. Tetraethylthiuram (TTD) partially reduced, but did not totally blocked AAP-induced neuroblastoma death.
Cells were incubated with vehicle (DMSO), TTD (0.1 µM) or AAP alone or in the presence of TTD (0.1 µM) for 48 h. The percentage of LDH released to the culture medium was taken as an index of cell death. Data are expressed as mean ± SEM of 4 independent experiments carried in triplicate. ***p<0.001, as compared to AAP.
Figure 4
Figure 4. AAP-induced neuroblastoma death involves ROS production and activation of NFkB signalling pathway.
(a) Time-course of AAP-induced increase production of ROS. Data are expressed as mean ± SEM of 4 independent experiments carried in triplicate. **p<0.01, ***p<0.001, as compared to vehicle-treated cells. (b) Time-course of p65 translocation to the nucleus. Cytosolic and nuclear fractions were obtained from AAP-treated neuroblastoma cells and p65 expression was determined. Densitometric analysis of p65 in the cytosolic (left) and nuclear (right) fractions are represented in the lower panels. α-tubulin and H2A levels were used as cytosolic and nuclear protein loading controls respectively. The figure is representative of 3 independent experiments. (c) Time-course of p65 activation by phosphorylation at Ser536. Cytosolic and nuclear fractions were obtained from AAP-treated neuroblastoma cells and the levels of phophorylated p65 at Ser 536 (p-p65-Ser536) were studied. Densitometric analysis of p-p65-Ser536 in the cytosolic (left) and nuclear (right) fractions are represented in the lower panels. α-tubulin and H2A levels were used as cytosolic and nuclear protein loading controls respectively. The figure is representative of 3 independent experiments.
Figure 5
Figure 5. Effect of SN-50 and MnTBAP on AAP-induced p65 translocation and on SH-SY5Y viability.
(a) NFkB translocation to the nucleus was blocked by both SN-50 and MnTBAP. Densitometric analysis of p65 in the cytosolic (left) and nuclear (right) fractions are represented in the lower panels. α-tubulin and H2A levels were used as cytosolic and nuclear protein loading controls respectively. The figure is representative of 3 independent experiments. (b) SN-50 as well as MnTBAP significantly reduced AAP-induced cytotoxicity in SH-SY5Y cells. Data are expressed as mean ± SEM of 4 independent experiments carried in triplicate. ***p<0.001, as compared to AAP-treated cells.
Figure 6
Figure 6. Effect of SN-50 and MnTBAP on AAP-induced Bax translocation and cytochrome c release from mitochondria.
SH-SY5Y cells were treated with vehicle (DMSO 1%) or AAP for different times in the presence or absence of SN-50 or MnTBAP and cytosolic and mitochondrial fractions were obtained. (a) Bax protein levels were determined by immunoblot in samples obtained 24 h after treatment. Densitometric analysis of Bax in the mitochondrial (left) and cytosolic (right) fractions are represented in the lower panels. α-tubulin and COX-IV protein levels were used as cytosolic and mitochondria protein loading controls respectively. The figure is representative of three independent experiments. (b) Cytochrome c (cyt. c) was analysed by immunoblot in samples obtained 48 h after treatment. Densitometric analysis of cyt. c in the mitochondrial (left) andcytosolic (right) fractions are represented in the lower panels. α-tubulin and COX-IV protein levels were used as cytosolic and mitochondria protein loading controls respectively. The figure is representative of three independent experiments.
Figure 7
Figure 7. AAP-induced increase in IL-1β contributes to SH-SY5Y neuroblastoma cell death.
(a) Time-course of AAP-induced IL-1β production. Data are expressed as mean ± SEM of 4 independent experiments carried in triplicate. *p<0.05; ***p<0.001, as compared to vehicle-treated cells. (b) Effect of SN-50 and MnTBAP on AAP-induced IL-1β production. Cells were incubated with vehicle (DMSO 1%, AAP alone or AAP plus either MnTABP or SN-50 for 24 hours. IL-1β levels were determined as indicated in Material and Methods. Data are expressed as mean ± SEM of 4 independent experiments carried in triplicate. ***p<0.001, as compared to AAP-treated cells. (c) Time-course of IL-1β-induced LDH release from SH-SY5Y neuroblastoma cells. The vehicle used was double distilled water (ddH2O). Data are expressed as mean ± SEM of 4 independent experiments carried in triplicate. *p<0.05; ***p<0.001, as compared to vehicle-treated cells. (d) Time-course of caspase 3 activity measured in total lysates obtained from 24 or 48 hours vehicle (ddH2O)- or IL-1β-treated cells. Data are expressed as mean ± SEM of 4 independent experiments carried in triplicate. ***p<0.001, as compared to vehicle-treated cells.
Figure 8
Figure 8. Bcl-xL over expression prevented AAP and IL-1β-induced neuroblastoma cell death.
(a) SH-SY5Y cells over expressing Bcl-xL and SH-SY5Y transfected with empty vector (Neo) were incubated in the presence of different concentrations of AAP and the percentage of LDH released was quantified as an index of cell death. Data are expressed as mean ± SEM of 4 independent experiments carried in triplicate. ***p<0.001, as compared to Neo cells. (b) IL-1β levels were measured in supernatants from SH-SY5Y cells over expressing Bcl-xL after exposure to vehicle (DMSO 1%) or AAP. Data are expressed as mean ± SEM of 4 independent experiments carried in triplicate. ***p<0.001, as compared to vehicle-treated cells. (c) Time-course of IL-1β-induced LDH release from SH-SY5Y cells over expressing Bcl-xL. The vehicle used was double distilled water (ddH2O). Data are expressed as mean ± SEM of 4 independent experiments carried in triplicate.
Figure 9
Figure 9. Effect of acetaminophen (AAP) on SK-N-MC and U87MG cell lines.
(a) SK-N-MC were incubated in the presence of AAP at different concentrations for 24, 48 and 72 h and the percentage of LDH released to culture media, as an index of cell death, (left graph) and the percentage of MTT transformed, as an index of mitochondrial function impairment, were quantified. (b) U87MG were incubated in the presence of AAP at different concentrations for 24, 48 and 72 h and the percentage of LDH released to culture media, as an index of cell death, (left graph) and the percentage of MTT transformed, as an index of mitochondrial function impairment, were quantified. (c) SK-N-MC (white bars) and U87MG (black bars) were incubated in the presence of AAP 2 mM for 72 h and the activity of caspase 3 (left graph) and the activity os caspase 1 (right graph) were quantified. (d) Time-course of AAP-induced increase production of ROS in SK-N-MC (white bars) and in U87MG (black bars). Data are expressed as mean ± SEM of 4 independent experiments carried in triplicate. *p<0.05, **p<0.01, ***p<0.001 as compared to vehicle-treated cells.

Similar articles

Cited by

References

    1. Heck JE, Ritz B, Hung RJ, Hashibe M, Boffetta P (2009) The epidemiology of neuroblastoma: a review. Paediatr Perinat Epidemiol 23: 125–143. - PubMed
    1. Ambros PF, Ambros IM, Brodeur GM, Haber M, Khan J, et al. (2009) International consensus for neuroblastoma molecular diagnostics: report from the International Neuroblastoma Risk Group (INRG) Biology Committee. Br J Cancer 100: 1471–1482. - PMC - PubMed
    1. Weinstein JL, Katzenstein HM, Cohn SL (2003) Advances in the diagnosis and treatment of neuroblastoma. Oncologist 8: 278–292. - PubMed
    1. Kaatsch P (2010) Epidemiology of childhood cancer. Cancer Treat Rev 36: 277–285. - PubMed
    1. Haase GM, Perez C, Atkinson JB (1999) Current aspects of biology, risk assessment, and treatment of neuroblastoma. Semin Surg Oncol 16: 91–104. - PubMed

Publication types

MeSH terms