. 2013 Jan 4;288(1):255-63.
doi: 10.1074/jbc.M112.393918. Epub 2012 Nov 20.

Increase in serum Ca2+/Mg2+ ratio promotes proliferation of prostate cancer cells by activating TRPM7 channels

Affiliations

Increase in serum Ca2+/Mg2+ ratio promotes proliferation of prostate cancer cells by activating TRPM7 channels

Yuyang Sun et al. J Biol Chem. .

Abstract

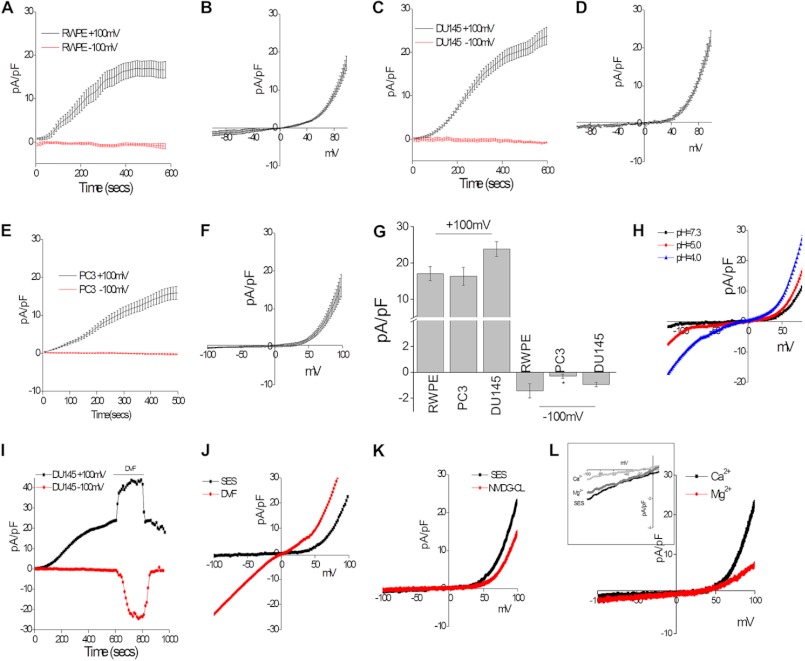
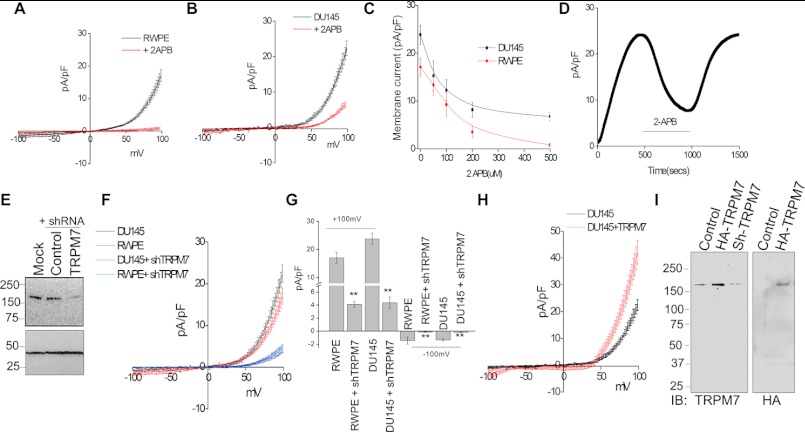
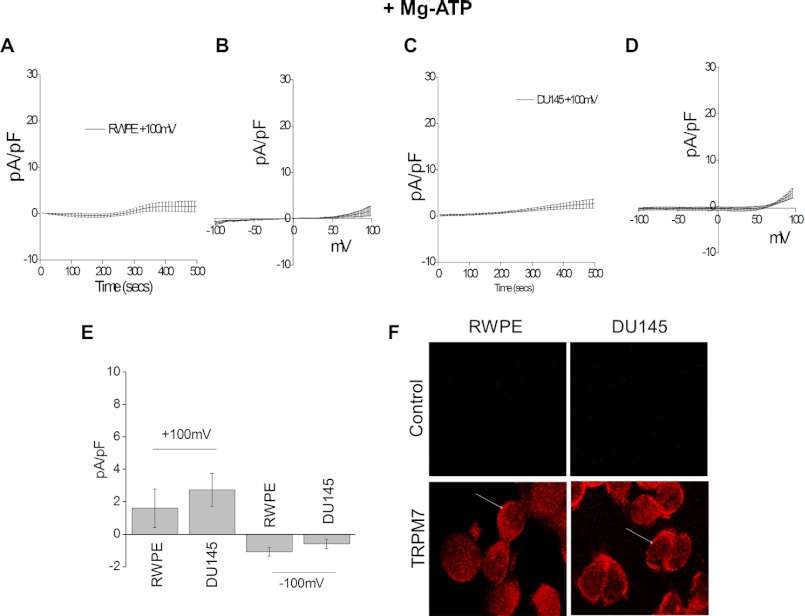
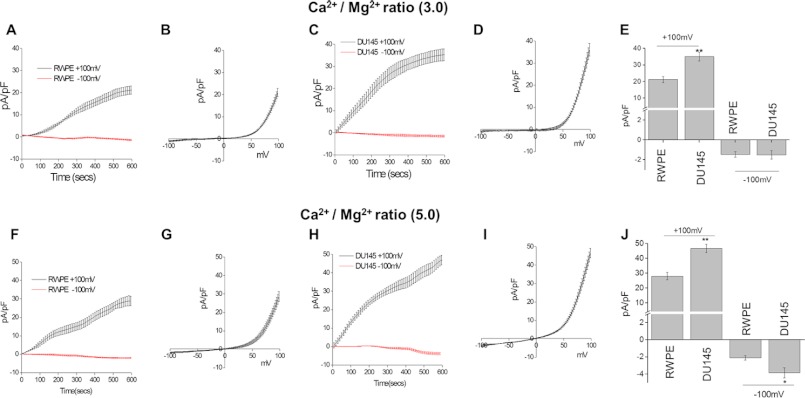
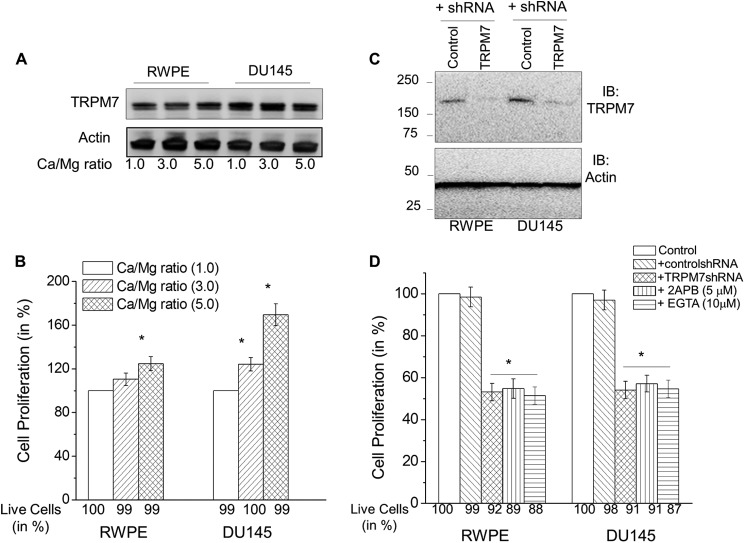
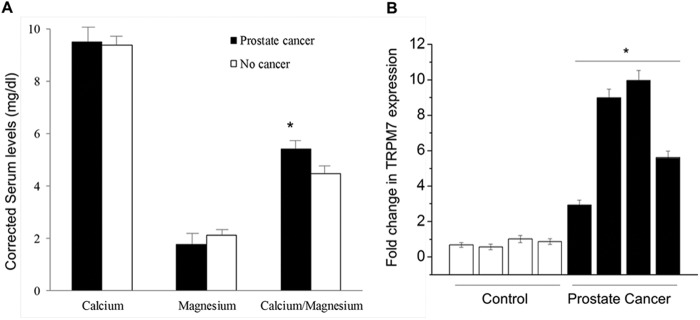
TRPM7 is a novel magnesium-nucleotide-regulated metal current (MagNuM) channel that is regulated by serum Mg(2+) concentrations. Changes in Mg(2+) concentration have been shown to alter cell proliferation in various cells; however, the mechanism and the ion channel(s) involved have not yet been identified. Here we demonstrate that TRPM7 is expressed in control and prostate cancer cells. Supplementation of intracellular Mg-ATP or addition of external 2-aminoethoxydiphenyl borate inhibited MagNuM currents. Furthermore, silencing of TRPM7 inhibited whereas overexpression of TRPM7 increased endogenous MagNuM currents, suggesting that these currents are dependent on TRPM7. Importantly, although an increase in the serum Ca(2+)/Mg(2+) ratio facilitated Ca(2+) influx in both control and prostate cancer cells, a significantly higher Ca(2+) influx was observed in prostate cancer cells. TRPM7 expression was also increased in cancer cells, but its expression was not dependent on the Ca(2+)/Mg(2+) ratio per se. Additionally, an increase in the extracellular Ca(2+)/Mg(2+) ratio led to a significant increase in cell proliferation of prostate cancer cells when compared with control cells. Consistent with these results, age-matched prostate cancer patients also showed a subsequent increase in the Ca(2+)/Mg(2+) ratio and TRPM7 expression. Altogether, we provide evidence that the TRPM7 channel has an important role in prostate cancer and have identified that the Ca(2+)/Mg(2+) ratio could be essential for the initiation/progression of prostate cancer.


Figures

FIGURE 1.
FIGURE 1.
Characterization of intracellular Mg2+-dependent inward and outward rectifying currents in control and prostate cancer cells. A, representative traces showing changes of whole cell currents in conditions of 1.2 mm Mg2+ and 1.5 mm Ca2+ external solution from normal prostate cells (RWPE) that were activated by the depletion of intracellular Mg2+. Outward currents (top curve) were measured at +100 mV; inward currents (bottom curve; red) were measured at −100 mV. Average IV curves (developed from maximum currents) under this condition are shown in B. C and E, changes of whole cell currents under similar conditions from prostate cancer cells (DU145 and PC3) are shown. Outward currents were again measured at +100 mV; inward currents were measured at −100 mV (bottom line; red). IV curves (developed from maximum currents) of these cells under this condition are shown in D and F. G, average (8–10 recordings) current intensity at +100 and −100 mV under these conditions is shown. H, representative IV curves of prostate cancer cells (DU145) under conditions of pH 7.3, pH 5.0, and pH 4.0. Time courses of membrane current recorded on prostate cancer cells (DU145) are shown in I. Removal of bath Ca2+ and Mg2+ (divalent ion-free (DVF)) induced a remarkable increase of inward and outward currents. IV curves of corresponding time points are shown in J. K, representative IV curves of prostate cancer cells (DU145) under conditions of standard external solution (SES) (1.2 mm Mg2+, 1.5 mm Ca2+, and 145 mm Na+) and NMDG-Cl (Na+ replaced with NMDG in the external solution). L, representative IV curves of prostate cancer cells (DU145) under conditions of 3 mm Ca2+ and 150 mm NMDG-Cl external solution or 3 mm Mg2+ and 150 mm NMDG-Cl external solution. The inset shows a magnified view of the reverse potential under different conditions. Error bars represent ±S.E.
FIGURE 2.
FIGURE 2.
Decrease in intracellular Mg2+ led to inward and outward rectifying currents that were dependent on TRPM7. Bath application of 500 μm 2APB inhibited MagNuM current in RWPE and cancer cells, and average IV curves in control (A) and cancer cells (B) are shown. A dose-dependent inhibition of MagNuM currents by 2APB in RWPE and DU145 cells is shown in C. D represents outward currents in DU145 cells. Once the currents reached their peak, 500 μm 2APB was applied to the bath followed by recovery of the current by washing out 2APB. E, representative blots indicating DU145 cells expressing shRNA targeting TRPM7 or control non-targeting shRNA. Mock represents similar conditions without any shRNA plasmid. Cell lysates from DU145 cells were resolved on NuPAGE 3–8% Tris acetate gels and analyzed by Western blotting using TRPM7 antibodies (Epitomics). β-Actin was used as a loading control. Respective IV curves of cells transfected with shRNA targeting TRPM7 in RWPE and DU145 cells are show in F. Average (6–10 recordings) current intensity under these conditions in RWPE and DU145 cells are shown in G. ** indicates values (mean ± S.E.) that are significantly different from control (p < 0.01). H, IV curves from control or TRPM7-overexpressing prostate cancer cells (DU145). I, full blots of DU145 cells (control) or cells either overexpressing TRPM7 (HA-TRPM7) or TRPM7 shRNA (Sh-TRPM7). Western blots were performed either using TRPM7 or HA antibodies. IB, immunoblot. Error bars represent ±S.E.
FIGURE 3.
FIGURE 3.
Effect of intracellular Mg-ATP on prostate cells. Individual representative traces showing inhibition of cation currents by intracellular application of 2 mm Mg-ATP on normal prostate cells (A) and prostate cancer cells (C) are shown. Respective IV curves (developed from maximum currents) under these conditions on normal prostate cells (B) and prostate cancer cells (D) are shown. E, average (6–10 recordings) current intensity at +100 and −100 mV under these conditions is shown. F, representative confocal images showing TRPM7 staining in control RWPE and DU145 cancer cells. Controls shown here are respective cells that did not receive the primary antibodies but were treated with the secondary antibodies. Error bars represent ±S.E.
FIGURE 4.
FIGURE 4.
MagNuM currents were increased when Ca2+/Mg2+ ratio was increased in cancer cells. A, representative traces showing changes of whole cell currents from normal prostate cells under conditions of a Ca2+/Mg2+ ratio of 3.0 (or 3 mm Ca2+ and 0 mm Mg2+) in external solution. Top, outward current measured at +100 mV; bottom, inward current measured at −100 mV. The IV curve under this condition is shown in B. C, representative traces showing changes of whole cell currents under similar conditions from prostate cancer cells. Top, outward current measured at +100 mV; bottom, inward current measured at −100 mV. The IV curve under this condition is shown in D. E, average (8–10 recordings) current intensity at +100 and −100 mV under these conditions. ** indicates values (mean ± S.E.) that are significantly different from control (p < 0.01). F, representative traces showing changes of whole cell currents from normal prostate cells under conditions of a Ca2+/Mg2+ ratio of 5.0 (or 5 mm Ca2+ and 0 mm Mg2+) in the external solution. Top, outward current measured at +100 mV; bottom, inward current measured at −100 mV. The IV curve under this condition is shown in G. H, changes of whole cell currents under similar conditions from prostate cancer cells. Top, outward current measured at +100 mV; bottom, inward current measured at −100 mV. The IV curve under this condition is shown in I. J, average (8–10 recordings) current intensity under these conditions. ** indicates values (mean ± S.E.) that are significantly different from control (p < 0.01). Error bars represent ±S.E.
FIGURE 5.
FIGURE 5.
Increased calcium entry via the MagNuM channels increased cell proliferation. A, representative blots indicating the expression of TRPM7 under various Ca2+/Mg2+ conditions. Cell lysates from control (RWPE) and DU145 cells were resolved on NuPAGE 3–8% Tris acetate gels and analyzed by Western blotting. Antibodies used are labeled in the figure; β-actin was used as a loading control. B, cell proliferation (MTT assays) under different Ca2+/Mg2+ ratios in control RWPE and DU145 cells. Values are normalized and expressed as percentages. * indicates significance (p < 0.05) versus control. The number of live cells in each condition was quantified using trypan blue and is shown as a percentage at the bottom of the bar graph. C, representative Western blots indicating the expression of TRPM7 in RWPE and DU145 cells expressing either control or TRPM7 shRNA. The top panel was probed with TRPM7 antibodies; the bottom panel was probed with control actin antibodies. D, cell proliferation (MTT assay) under different conditions of varying Ca2+/Mg2+ ratios in RWPE and DU145 cells. Values are expressed as percent change (mean ± S.E.). * indicates significance (p < 0.05) versus control cells. The number of live cells in each condition was quantified using trypan blue and is shown as a percentage. IB, immunoblot. Error bars represent ±S.E.
FIGURE 6.
FIGURE 6.
Higher serum calcium to magnesium ratio and TRPM7 expression were observed in newly diagnosed prostate cancer patients. A, serum calcium and magnesium levels (in mg/dl) were obtained from age-matched control (cases that had measured magnesium; a total of three cases) and prostate cancer patients (positive biopsies that had measured magnesium at the date of their diagnosis; a total of 25 cases). Total serum calcium was adjusted using albumin that was estimated to be at 4 g/dl by a standard formula (corrected serum calcium = total calcium + 0.8 × (4 − patients albumin)). Values are expressed as mean ± S.D. * indicates significance (p < 0.05). B, RNA was extracted from four controls and age-matched prostate cancer samples, and quantitative RT-PCR was performed. Values represent mean ± S.E. of -fold change in TRPM7 expression when compared with GAPDH from at least two independent experiments. Values are expressed as mean ± S.E.

Similar articles

Cited by

References

    1. Berridge M. J., Brown K. D., Irvine R. F., Heslop J. P. (1985) Phosphoinositides and cell proliferation. J. Cell Sci. Suppl. 3, 187–198 - PubMed
    1. Whitfield J. F., Boynton A. L., MacManus J. P., Sikorska M., Tsang B. K. (1979) The regulation of cell proliferation by calcium and cyclic AMP. Mol. Cell. Biochem. 27, 155–179 - PubMed
    1. Roderick H. L., Cook S. J. (2008) Ca2+ signalling checkpoints in cancer: remodelling Ca2+ for cancer cell proliferation and survival. Nat. Rev. Cancer 8, 361–375 - PubMed
    1. Flourakis M., Prevarskaya N. (2009) Insights into Ca2+ homeostasis of advanced prostate cancer cells. Biochim. Biophys. Acta 1793, 1105–1109 - PubMed
    1. Prevarskaya N., Skryma R., Shuba Y. (2004) Ca2+ homeostasis in apoptotic resistance of prostate cancer cells. Biochem. Biophys. Res. Commun. 322, 1326–1335 - PubMed

Publication types