. 2013 Feb;33(2):215-24.
doi: 10.1038/jcbfm.2012.156. Epub 2012 Nov 21.

Measuring biexponential transverse relaxation of the ASL signal at 9.4 T to estimate arterial oxygen saturation and the time of exchange of labeled blood water into cortical brain tissue

Affiliations

Measuring biexponential transverse relaxation of the ASL signal at 9.4 T to estimate arterial oxygen saturation and the time of exchange of labeled blood water into cortical brain tissue

Jack A Wells et al. J Cereb Blood Flow Metab. 2013 Feb.

Abstract

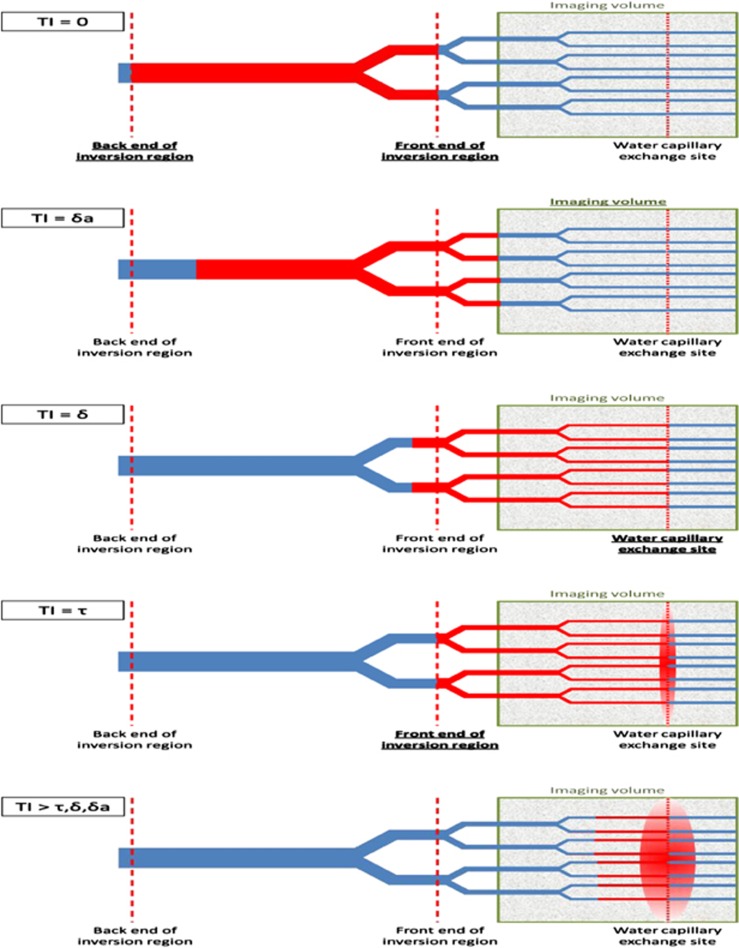
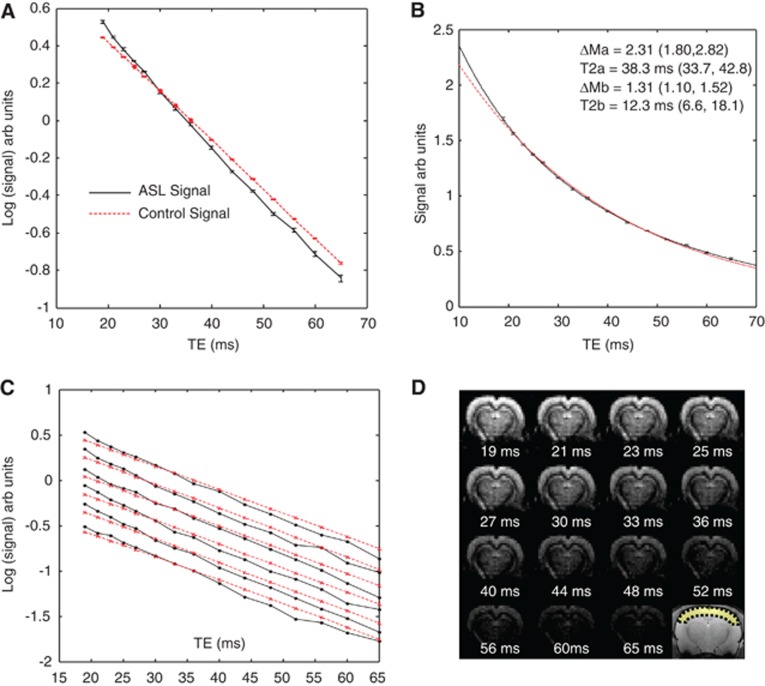
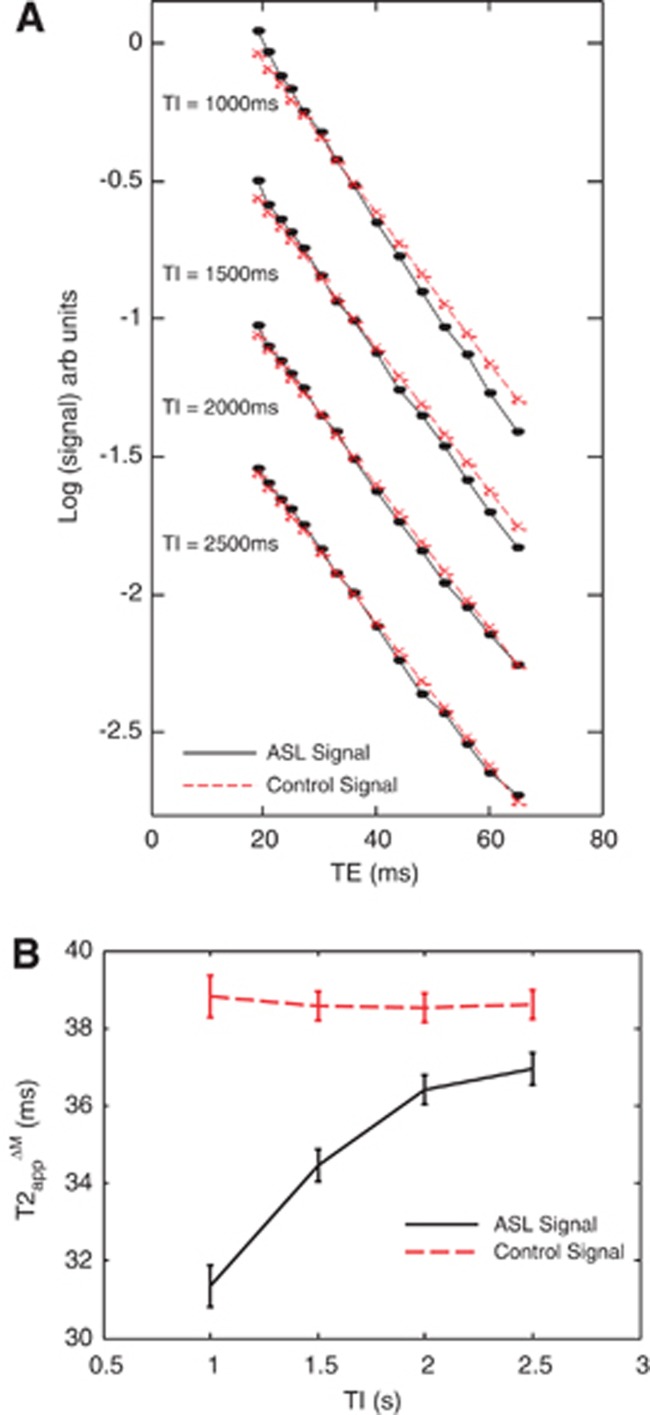
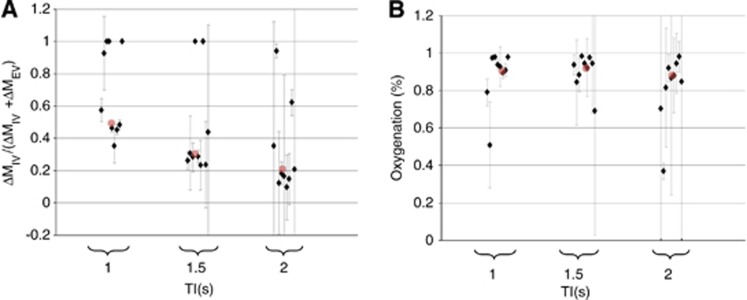
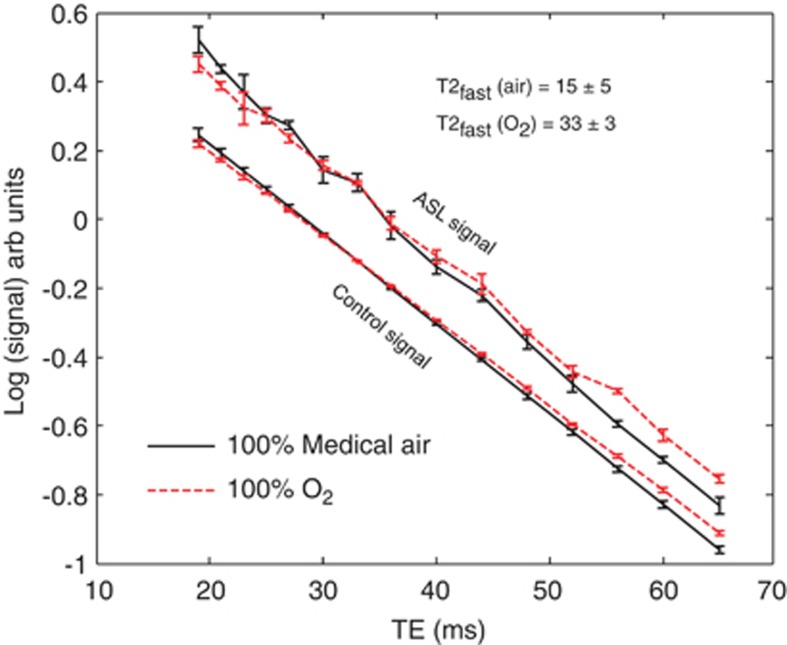
The transverse decay of the arterial spin labeling (ASL) signal was measured at four inflow times in the rat brain cortex at 9.4 T. Biexponential T2 decay was observed that appears to derive from different T2 values associated with labeled water in the intravasculature (IV) and extravascular (EV) compartments. A two compartment biexponential model was used to assess the relative contribution of the IV and EV compartments to the ASL signal, without assuming a value for T2 of labeled blood water in the vessels. This novel methodology was applied to estimate the exchange time of blood water into EV tissue space and the oxygen saturation of blood on the arterial side of the vasculature. The mean exchange time of labeled blood water was estimated to be 370±40 ms. The oxygen saturation of the arterial side of the vasculature was significantly less than 100% (∼85%), which may have implications for quantitative functional magnetic resonance imaging studies where the arterial oxygen saturation is frequently assumed to be 100%.


Figures

Figure 1
Figure 1
A schematic representation of the delivery of labeled blood water (in red) to the brain at increasing inflow time (TI). After the inversion pulse, blood water is delivered to the capillary bed where it exchanges into the extravascular (EV) tissue space. δa is the arterial transit time, τ is the temporal length of the tagged bolus, and δ is the tissue transit time (the time taken for labeled blood water to exchange into the EV tissue after the labeling pulse). In this work, we define exchange time to be δδa (the time taken for labeled blood water to exchange into the tissue once it has arrived into the imaging voxel). In this study, we aim to exploit the difference in vessel (∼15 ms) and tissue (∼38 ms) T2 to estimate the distribution of tagged spins in the IV and EV compartments at variable TI to estimate the exchange time. The color reproduction of this figure is available at the Journal of Cerebral Blood Flow and Metabolism journal online.
Figure 2
Figure 2
The data acquired in part (i). (A) The mean cortical arterial spin labeling (ASL) and control signal (log scale) across the six subjects. (B) The mean cortical ASL signal (linear scale) across the six subjects with the line of best fit of equation 1 to the data. A monoexponential fit is also shown (red dashed line). (C) The mean cortical ASL (black lines) and control signal (red dashed lines) for each of the individual six subjects (log scale). (D) ASL images at increasing echo time (shown below each image) for a single subject. An anatomic reference image is also shown together with the cortical region of interest (ROI). The color reproduction of this figure is available at the Journal of Cerebral Blood Flow and Metabolism journal online.
Figure 3
Figure 3
The data acquired in part (ii). (A) The mean cortical arterial spin labeling (ASL) and control signal (log scale) across all nine subjects at the five different inflow times (TIs). (B). The T2app of the ASL and control signal at increasing inversion time (0.5 to 2.5 seconds) across the nine subjects.
Figure 4
Figure 4
The data acquired in part (ii). (A) The estimated ΔMIV/(ΔMIV+ΔMEV) ratio of the arterial spin labeling (ASL) signal at increasing inflow time (TI) for each of the individual nine subjects. The red dots represent the median ΔMIV/(ΔMIV+ΔMEV) ratio across all nine subjects for each TI. (B) The estimated oxygen saturation of the IV ASL signal as a function of TI for each of the nine subjects. The red dots represent the median oxygen saturation across all nine subjects for each TI. EV, extravascular; IV, intravascular. The color reproduction of this figure is available at the Journal of Cerebral Blood Flow and Metabolism journal online.
Figure 5
Figure 5
The data acquired in part (iii). The mean cortical arterial spin labeling (ASL) (upper plots) and control (lower plots) signal under medical air (black solid line) and 100% O2 across the three subjects.

References

    1. Morse OC, Singer JR. Blood Velocity Measurements in Intact Subjects. Science. 1970;170:440–441. - PubMed
    1. Detre JA, Leigh JS, Williams DS, Koretsky AP. Perfusion imaging. Magn Res Med. 1992;23:37–45. - PubMed
    1. Williams DS, Detre JA, Leigh JS, Koretsky AP. Magnetic resonance imaging of perfusion using spin inversion of arterial water. Proc Natl Acad Sci. 1992;89:212–216. - PMC - PubMed
    1. Wolf RL, Detre JA. Clinical neuroimaging using arterial spin-labeledperfusion magnetic resonance imaging. Neurotherapeutics. 2007;4:346–359. - PMC - PubMed
    1. Detre JA, Rao H, Wang DJ, Chen YF, Wang Z. Applications of arterial spin labeled MRI in the brain. J Magn Reson Imaging. 2012;35:1026–1037. - PMC - PubMed

LinkOut - more resources