

Oxygen consumption rates during three different neuronal activity states in the hippocampal CA3 network
- PMID: 23168532
- PMCID: PMC3564197
- DOI: 10.1038/jcbfm.2012.165
Oxygen consumption rates during three different neuronal activity states in the hippocampal CA3 network
Abstract
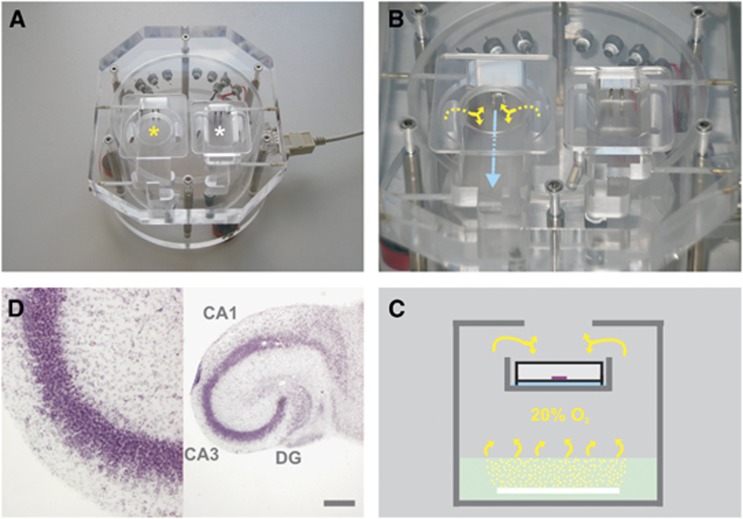
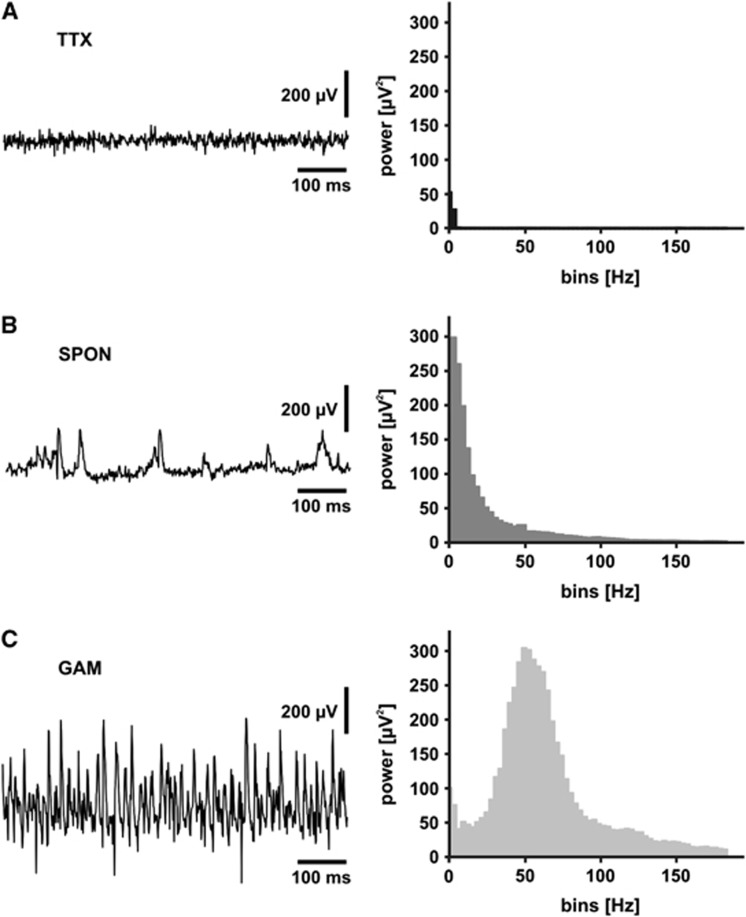
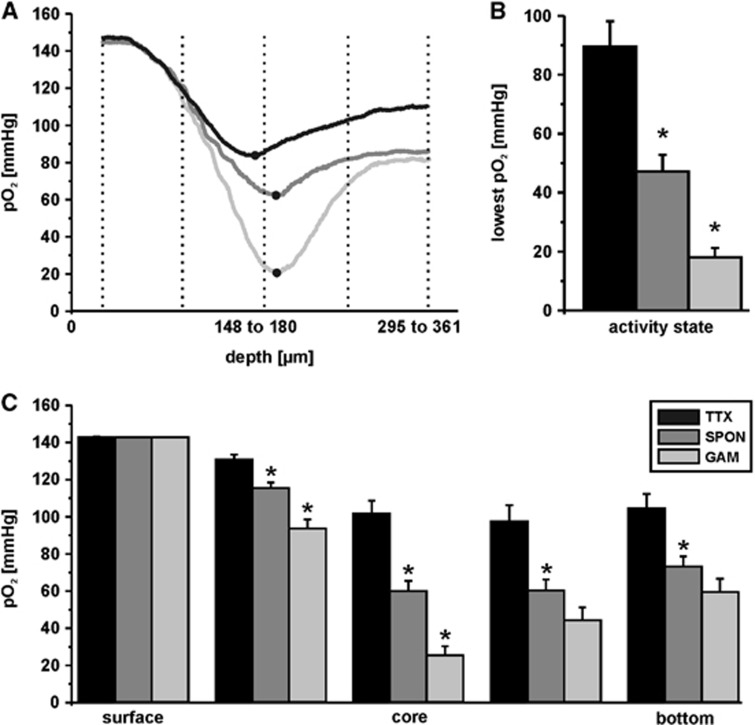
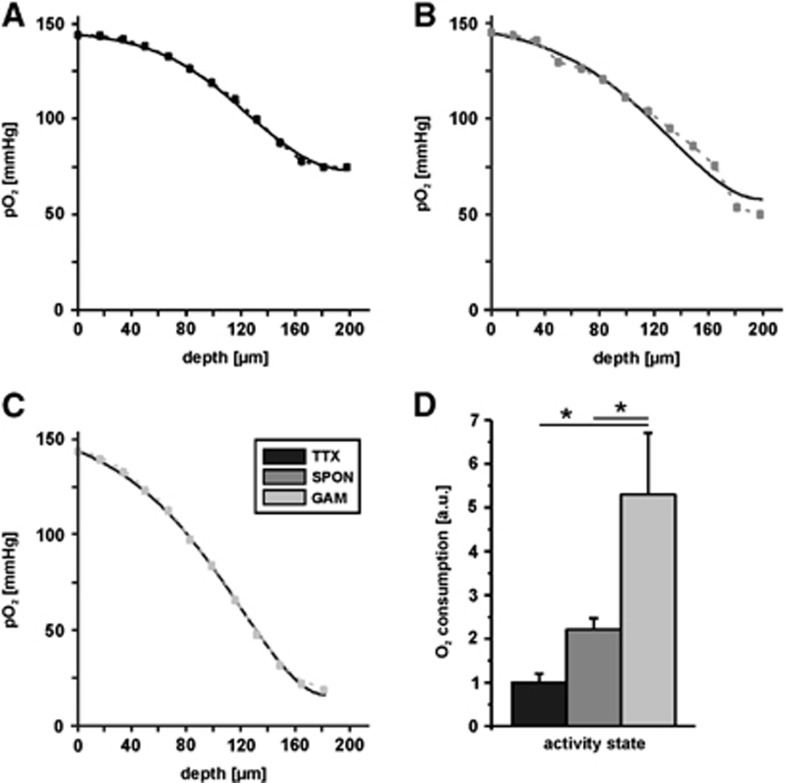
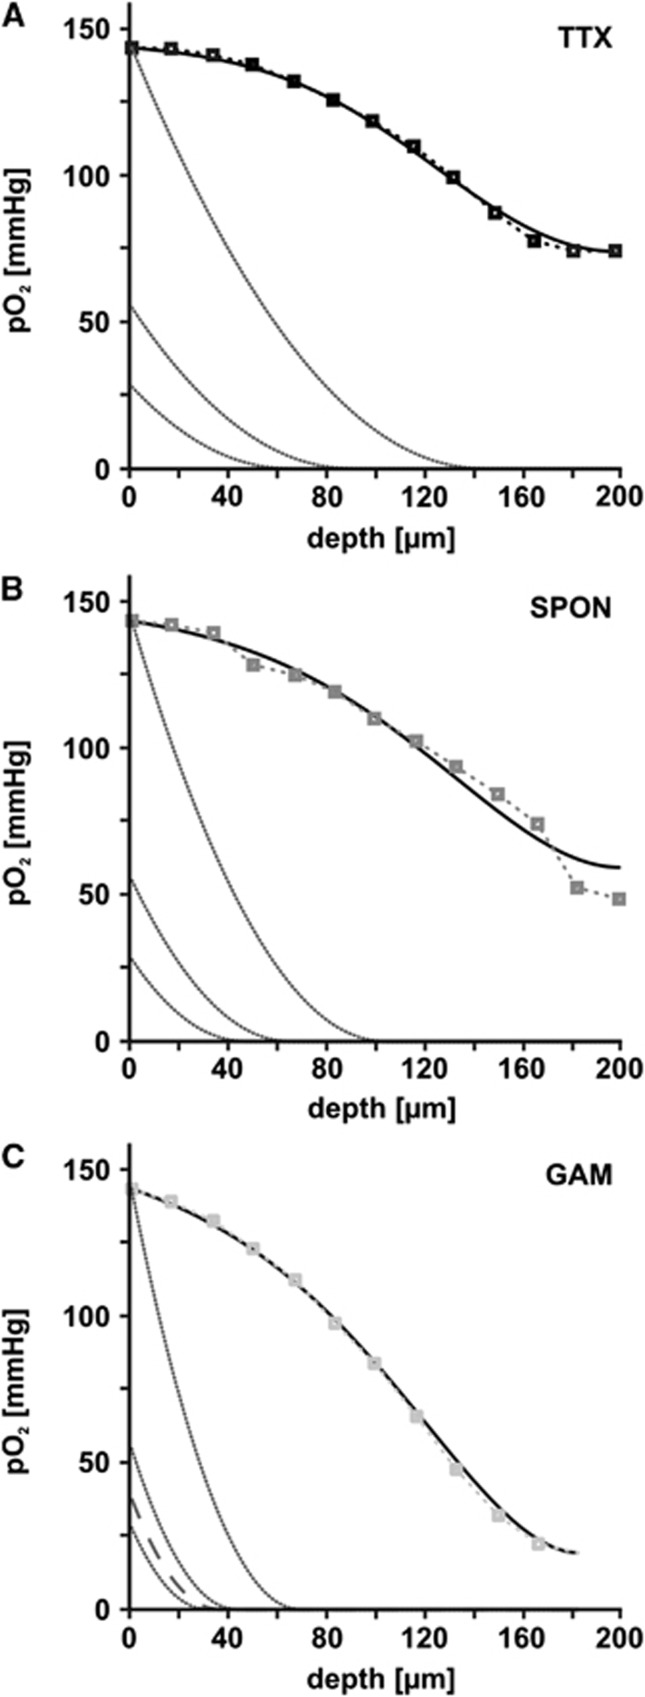
The brain is an organ with high metabolic rate. However, little is known about energy utilization during different activity states of neuronal networks. We addressed this issue in area CA3 of hippocampal slice cultures under well-defined recording conditions using a 20% O(2) gas mixture. We combined recordings of local field potential and interstitial partial oxygen pressure (pO(2)) during three different activity states, namely fast network oscillations in the gamma-frequency band (30 to 100 Hz), spontaneous network activity and absence of spiking (action potentials). Oxygen consumption rates were determined by pO(2) depth profiles with high spatial resolution and a mathematical model that considers convective transport, diffusion, and activity-dependent consumption of oxygen. We show that: (1) Relative oxygen consumption rate during cholinergic gamma oscillations was 2.2-fold and 5.3-fold higher compared with spontaneous activity and absence of spiking, respectively. (2) Gamma oscillations were associated with a similar large decrease in pO(2) as observed previously with a 95% O(2) gas mixture. (3) Sufficient oxygenation during fast network oscillations in vivo is ensured by the calculated critical radius of 30 to 40 μm around a capillary. We conclude that the structural and biophysical features of brain tissue permit variations in local oxygen consumption by a factor of about five.
Figures
Similar articles
-
Gamma oscillations and spontaneous network activity in the hippocampus are highly sensitive to decreases in pO2 and concomitant changes in mitochondrial redox state.J Neurosci. 2008 Jan 30;28(5):1153-62. doi: 10.1523/JNEUROSCI.4105-07.2008. J Neurosci. 2008. PMID: 18234893 Free PMC article.
-
Maintaining network activity in submerged hippocampal slices: importance of oxygen supply.Eur J Neurosci. 2009 Jan;29(2):319-27. doi: 10.1111/j.1460-9568.2008.06577.x. Eur J Neurosci. 2009. PMID: 19200237 Free PMC article.
-
Simultaneous activation of gamma and theta network oscillations in rat hippocampal slice cultures.J Physiol. 2002 Mar 15;539(Pt 3):857-68. doi: 10.1113/jphysiol.2001.013050. J Physiol. 2002. PMID: 11897855 Free PMC article.
-
Kainate receptors and rhythmic activity in neuronal networks: hippocampal gamma oscillations as a tool.J Physiol. 2005 Jan 1;562(Pt 1):65-72. doi: 10.1113/jphysiol.2004.077388. Epub 2004 Oct 28. J Physiol. 2005. PMID: 15513934 Free PMC article. Review.
-
Network mechanisms of gamma oscillations in the CA3 region of the hippocampus.Neural Netw. 2009 Oct;22(8):1113-9. doi: 10.1016/j.neunet.2009.07.024. Epub 2009 Jul 22. Neural Netw. 2009. PMID: 19683412 Review.
Cited by
-
Parvalbumin interneuron vulnerability and brain disorders.Neuropsychopharmacology. 2021 Jan;46(2):279-287. doi: 10.1038/s41386-020-0778-9. Epub 2020 Jul 28. Neuropsychopharmacology. 2021. PMID: 32722660 Free PMC article. Review.
-
Gait Improvement in Chronic Stroke Survivors by Using an Innovative Gait Training Machine: A Randomized Controlled Trial.Int J Environ Res Public Health. 2021 Dec 25;19(1):224. doi: 10.3390/ijerph19010224. Int J Environ Res Public Health. 2021. PMID: 35010482 Free PMC article. Clinical Trial.
-
Digitoids: a novel computational platform for mimicking oxygen-dependent firing of neurons in vitro.Front Neuroinform. 2025 Jul 1;19:1549916. doi: 10.3389/fninf.2025.1549916. eCollection 2025. Front Neuroinform. 2025. PMID: 40665990 Free PMC article.
-
Pharmacological Inhibition of Class III Alcohol Dehydrogenase 5: Turning Remote Ischemic Conditioning Effective in a Diabetic Stroke Model.Antioxidants (Basel). 2022 Oct 18;11(10):2051. doi: 10.3390/antiox11102051. Antioxidants (Basel). 2022. PMID: 36290774 Free PMC article.
-
Lactate Attenuates Synaptic Transmission and Affects Brain Rhythms Featuring High Energy Expenditure.iScience. 2020 Jul 24;23(7):101316. doi: 10.1016/j.isci.2020.101316. Epub 2020 Jun 27. iScience. 2020. PMID: 32653807 Free PMC article.
References
-
- Erecińska M, Silver IA. Tissue oxygen tension and brain sensitivity to hypoxia. Respir Physiol. 2001;128:263–276. - PubMed
-
- Fox PT, Raichle ME, Mintun MA, Dence C. Nonoxidative glucose consumption during focal physiologic neural activity. Science. 1988;241:462–464. - PubMed
-
- Shulman RG, Hyder F, Rothman DL. Lactate efflux and the neuroenergetic basis of brain function. NMR Biomed. 2001;14:389–396. - PubMed
-
- Masamoto K, Omura T, Takizawa N, Kobayashi H, Katura T, Maki A, et al. Biphasic changes in tissue partial pressure of oxygen closely related to localized neural activity in guinea pig auditory cortex. J Cereb Blood Flow Metab. 2003;23:1075–1084. - PubMed
Publication types
MeSH terms
LinkOut - more resources
Full Text Sources
Miscellaneous
