

An Analysis of Distance from Collision Site to Pedestrian Residence in Pedestrian versus Automobile Collisions Presenting to a Level 1 Trauma Center
- PMID: 23169114
- PMCID: PMC3503430
An Analysis of Distance from Collision Site to Pedestrian Residence in Pedestrian versus Automobile Collisions Presenting to a Level 1 Trauma Center
Abstract
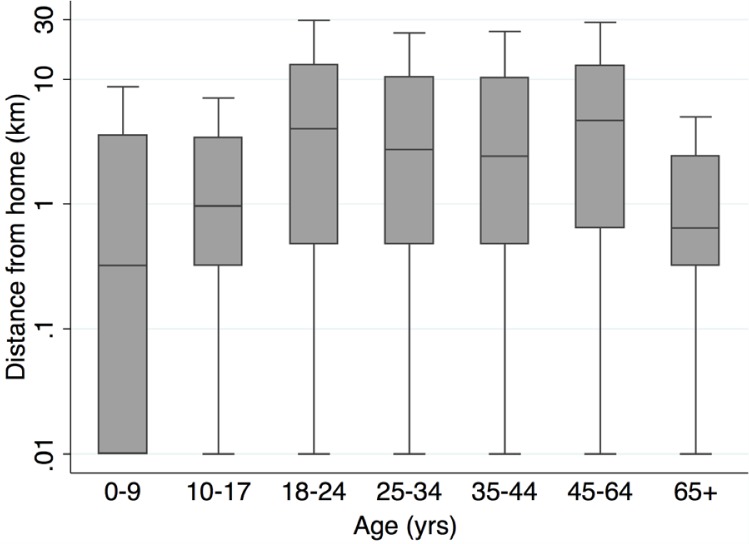
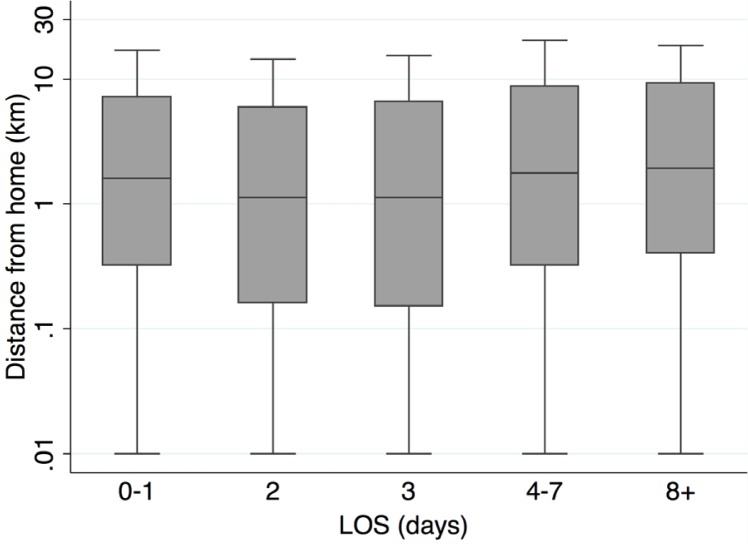
This study tests the hypothesis that most pedestrian collisions occur near victims' homes. Patients involved in automobile versus pedestrian collisions who presented to the emergency department at a Level I trauma center between January 2000 and December 2009 were included in the study. Patient demographics were obtained from the trauma registry. Home address was determined from hospital records, collision site was determined from the paramedic run sheet, and the shortest walking distance between the collision site and pedestrian residence was determined using Google Maps. We summarized distances for groups with the median and compared groups using the Kruskal-Wallis rank test. We identified 1917 pedestrian injury cases and identified both residence address and collision location for 1213 cases (63%). Forty-eight percent of the collisions were near home (within 1.1 km, 95% CI 45-51%). Median distance from residence to collision site was 1.4 km (interquartile range 0.3-7.4 km). For ages 0-17, the median distance 0.7 km, and 59% (95% CI 54-63%) of collisions occurred near home. For ages 65 and older, the median distance was 0.6 km and 65% (95% CI 55-73%) were injured near home. Distance did not differ by sex, race, ethnicity, or blood alcohol level. More severe injuries (Injury Severity Score ≥ 16) occurred further from home than less severe injuries (median 1.9 km vs. 1.3 km, p=.01). Patients with a hospital stay of 3 days or less were injured closer to home (median 1.3 km) than patients with a hospital stay of 4 days or more (median 1.8 km, p=.001). Twenty-two percent were injured within the same census tract as their home, 22% on the boundary of their home census tract, and 55% in a different census tract.
Figures
Similar articles
-
Integrating traffic safety data with area deprivation index: A method to better understand the causes of pediatric pedestrian versus automobile collisions.J Trauma Acute Care Surg. 2022 Nov 1;93(5):650-655. doi: 10.1097/TA.0000000000003666. Epub 2022 May 12. J Trauma Acute Care Surg. 2022. PMID: 35545801
-
Analysis of Pedestrian Fractures in Collisions Between Small Cars and Pedestrians Based on Surveillance Videos.Am J Forensic Med Pathol. 2022 Mar 1;43(1):11-17. doi: 10.1097/PAF.0000000000000709. Am J Forensic Med Pathol. 2022. PMID: 34510055 Free PMC article.
-
Older Adults at Increased Risk as Pedestrians in Victoria, Australia: An Examination of Crash Characteristics and Injury Outcomes.Traffic Inj Prev. 2015;16 Suppl 2:S161-7. doi: 10.1080/15389588.2015.1061662. Traffic Inj Prev. 2015. PMID: 26436227
-
Pedestrian injury patterns and risk in minibus collisions in China.Med Sci Monit. 2015 Mar 10;21:727-34. doi: 10.12659/MSM.893622. Med Sci Monit. 2015. PMID: 25754962 Free PMC article.
-
Older adult pedestrian trauma: A systematic review, meta-analysis, and GRADE assessment of injury health outcomes from an aggregate study sample of 1 million pedestrians.Accid Anal Prev. 2021 Mar;152:105970. doi: 10.1016/j.aap.2021.105970. Epub 2021 Feb 9. Accid Anal Prev. 2021. PMID: 33578216
Cited by
-
Alcohol Outlets, Neighborhood Retail Environments, and Pedestrian Injury Risk.Alcohol Clin Exp Res. 2018 Oct;42(10):1979-1987. doi: 10.1111/acer.13844. Epub 2018 Aug 13. Alcohol Clin Exp Res. 2018. PMID: 30102415 Free PMC article.
-
Close to home: an analysis of the relationship between location of residence and location of injury.J Trauma Acute Care Surg. 2015 Apr;78(4):860-5. doi: 10.1097/TA.0000000000000595. J Trauma Acute Care Surg. 2015. PMID: 25807410 Free PMC article.
-
Local vs. national: Epidemiology of pedestrian injury in a mid-Atlantic city.Traffic Inj Prev. 2018 May 19;19(4):440-445. doi: 10.1080/15389588.2018.1428961. Epub 2018 Apr 11. Traffic Inj Prev. 2018. PMID: 29341801 Free PMC article.
-
The road most travelled: the geographic distribution of road traffic injuries in England.Int J Health Geogr. 2013 Jun 5;12:30. doi: 10.1186/1476-072X-12-30. Int J Health Geogr. 2013. PMID: 23738624 Free PMC article.
-
Neighbourhood alcohol environment and injury risk: a spatial analysis of pedestrian injury in Baltimore City.Inj Prev. 2019 Oct;25(5):350-356. doi: 10.1136/injuryprev-2018-042736. Epub 2018 Mar 27. Inj Prev. 2019. PMID: 29588410 Free PMC article.
References
-
- Agran PF, Winn DG, Anderson CL. Differences in Child Pedestrian Injury Events by Location. Pediatrics. 1994;93(2):284–288. - PubMed
-
- Baker SP, O’Neill B, Haddon W, Jr, Long WB. The injury severity score: a method for describing patients with multiple injuries and evaluating emergency care. J Trauma. 1974;14(3):187–196. - PubMed
-
- Chakravarthy B, Anderson CL, Ludlow J, Lotfipour S, Vaca FE. The relationship of pedestrian injuries to socioeconomic characteristics in a large southern California county. Traffic Inj Prev. 2010;11(5):508–513. - PubMed
-
- Chakravarthy B, Anderson CL, Ludlow J, Lotfipour S, Vaca FE. A geographic analysis of collisions involving child pedestrians in a large Southern California county. Traffic Inj Prev. 2012;13:193–198. - PubMed