. 2012 Dec 11;109(50):E3513-22.
doi: 10.1073/pnas.1213974109. Epub 2012 Nov 19.

Ultrasensitivity of the Bacillus subtilis sporulation decision

Affiliations

Ultrasensitivity of the Bacillus subtilis sporulation decision

Jatin Narula et al. Proc Natl Acad Sci U S A. .

Abstract

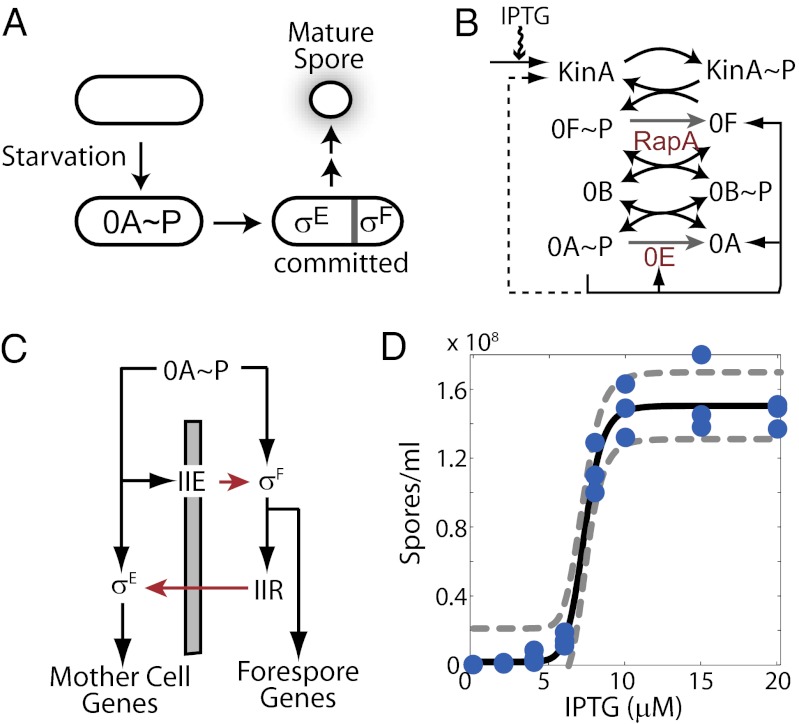
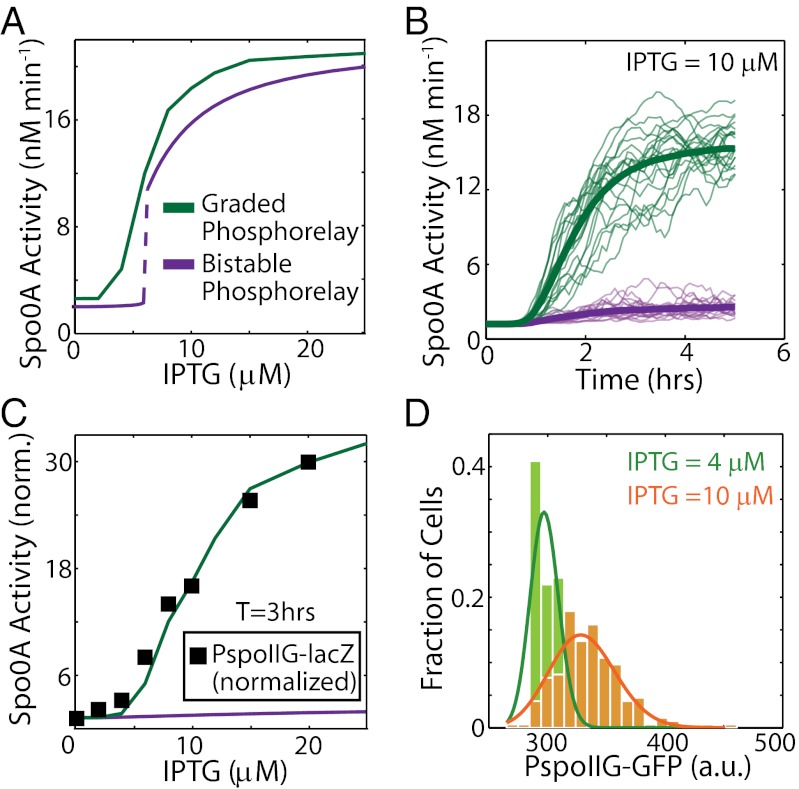
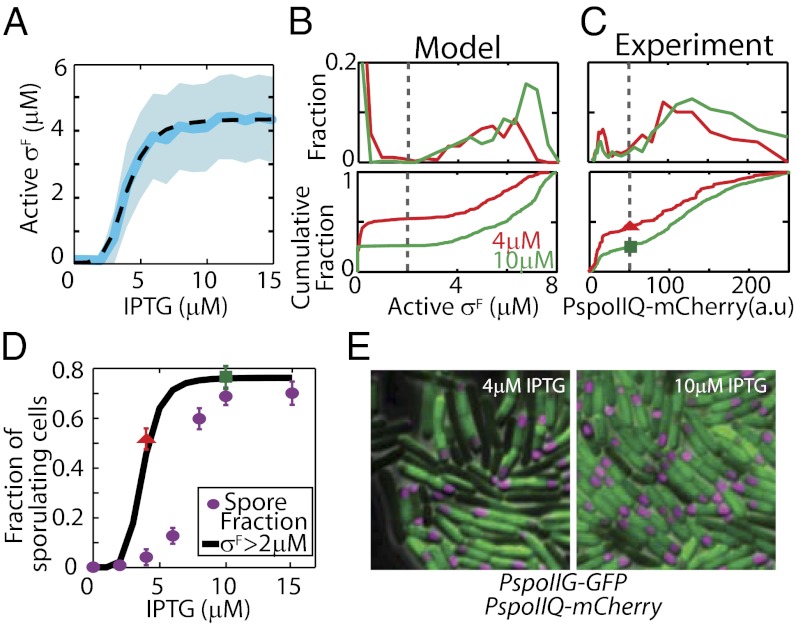
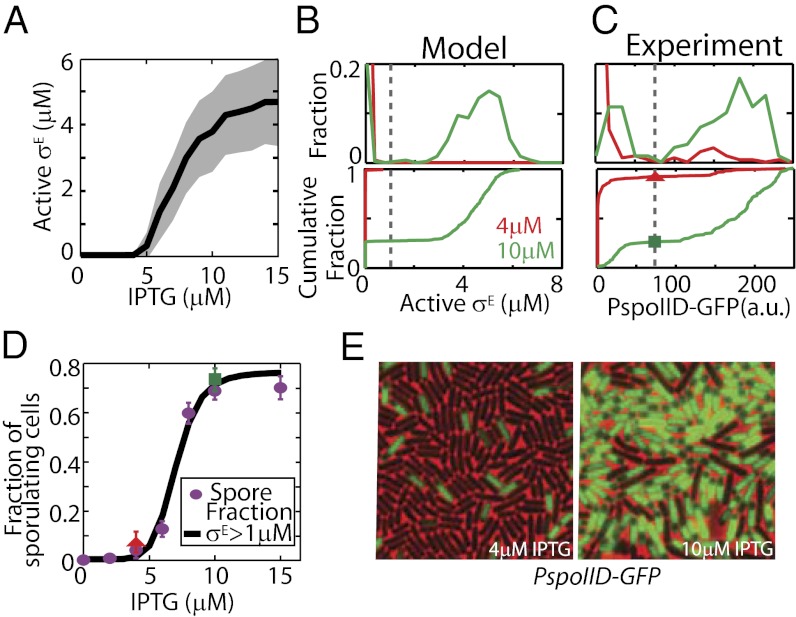
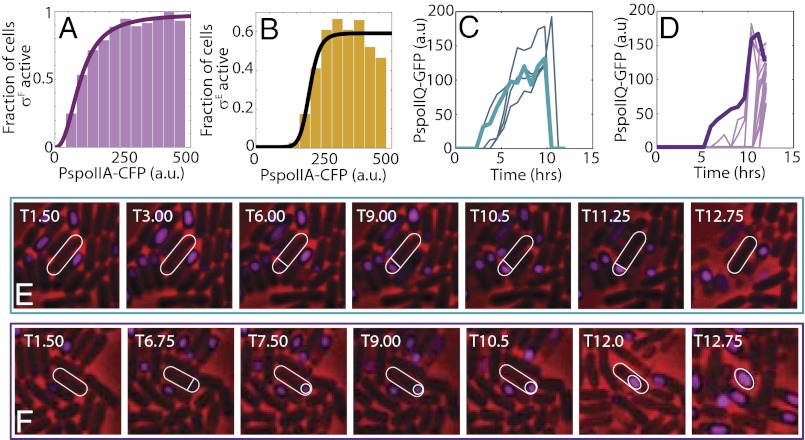
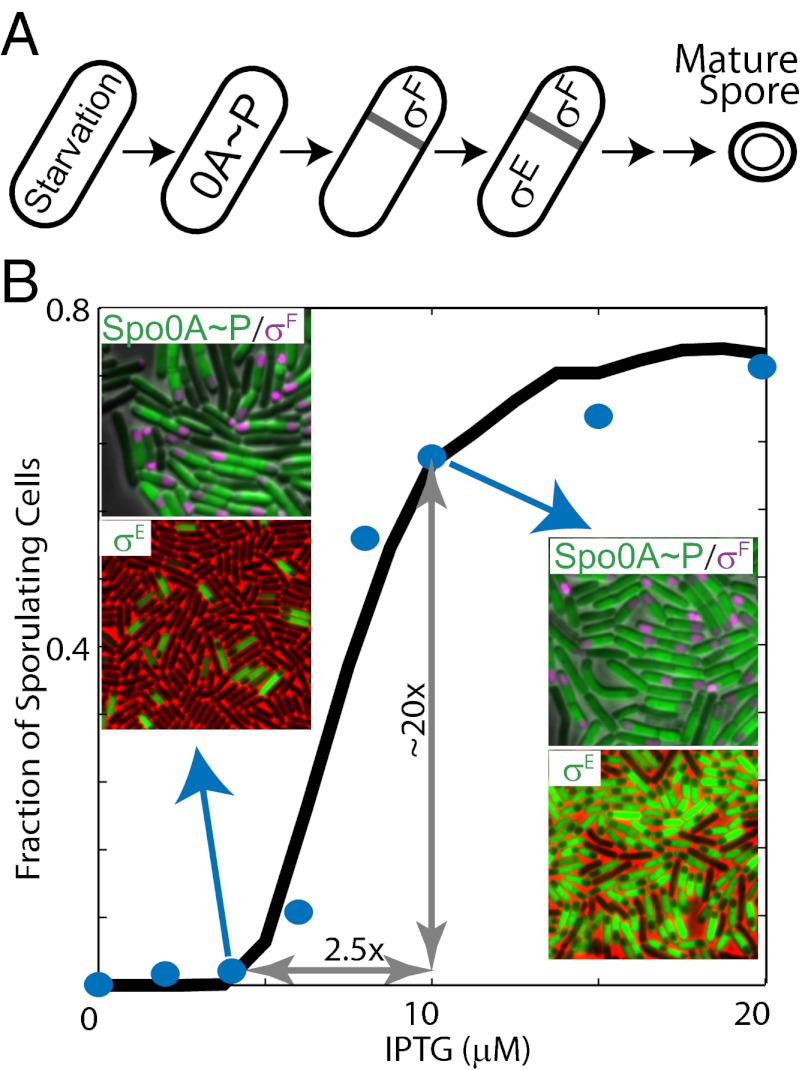
Starving Bacillus subtilis cells execute a gene expression program resulting in the formation of stress-resistant spores. Sporulation master regulator, Spo0A, is activated by a phosphorelay and controls the expression of a multitude of genes, including the forespore-specific sigma factor σ(F) and the mother cell-specific sigma factor σ(E). Identification of the system-level mechanism of the sporulation decision is hindered by a lack of direct control over Spo0A activity. This limitation can be overcome by using a synthetic system in which Spo0A activation is controlled by inducing expression of phosphorelay kinase KinA. This induction results in a switch-like increase in the number of sporulating cells at a threshold of KinA. Using a combination of mathematical modeling and single-cell microscopy, we investigate the origin and physiological significance of this ultrasensitive threshold. The results indicate that the phosphorelay is unable to achieve a sufficiently fast and ultrasensitive response via its positive feedback architecture, suggesting that the sporulation decision is made downstream. In contrast, activation of σ(F) in the forespore and of σ(E) in the mother cell compartments occurs via a cascade of coherent feed-forward loops, and thereby can produce fast and ultrasensitive responses as a result of KinA induction. Unlike σ(F) activation, σ(E) activation in the mother cell compartment only occurs above the KinA threshold, resulting in completion of sporulation. Thus, ultrasensitive σ(E) activation explains the KinA threshold for sporulation induction. We therefore infer that under uncertain conditions, cells initiate sporulation but postpone making the sporulation decision to average stochastic fluctuations and to achieve a robust population response.


Conflict of interest statement

The authors declare no conflict of interest.

Figures

Fig. 1.
Fig. 1.
Regulation of sporulation in B. subtilis. (A) Starvation triggers a switch from vegetative growth to sporulation and activates the sporulation master regulator Spo0A∼P (0A∼P). 0A∼P promotes the formation of asymmetrical septa and activates sigma factors σF and σE in the forespore and the mother cell, respectively. Only cells with active σF and σE are committed to progress through several additional stages before a mature spore appears. (B) Sporulation phosphorelay transfers phosphoryl groups from the kinases KinA–E (only KinA is shown) to the master regulator Spo0A via two phosphotransferases, Spo0B (0B) and Spo0F (0F). 0A∼P controls the expression of multiple genes in the phosphorelay through transcriptional feedback. KinA expression is indirectly regulated by 0A∼P (dashed arrow) in the WT phosphorelay, but in the ASI system, the KinA promoter is replaced with an IPTG-inducible promoter (solid arrow). (C) Sporulation network is hierarchically organized. 0A∼P directly controls the expression of σF and indirectly controls its activation [via SpoIIE (IIE) anchored in the polar septum, gray bar]. 0A∼P also controls the expression of σE and its activation via the σF-regulated expression of SpoIIR (black and red arrows show transcriptional and posttranslational regulatory interactions, respectively). (D) At a threshold level of KinA induction, spore counts increase dramatically (∼20-fold increase in spore count between 4 μM and 10 μM IPTG) to match WT sporulation levels. The blue circles represent experimentally measured spore counts. The solid and dashed lines represent the Hill equation fit and 95% confidence intervals, respectively.
Fig. 2.
Fig. 2.
Phosphorelay response is not ultrasensitive, due to response time requirements. (A) Modeling results show that the steady-state Spo0A activity computed as the rate of PspoIIG transcription can either be graded (green curve) or bistable and ultrasensitive (purple curve). (B) Stochastic simulations show that at 10 μM IPTG, PspoIIG expression increases significantly by 3 h after induction for the graded (green curves) phosphorelay, whereas bistable (purple curves) phosphorelay shows little change in expression from PspoIIG. Thin curves are individual stochastic simulation trajectories, and thick curves indicate the average of 400 such trajectories. (C) Measurements of the increase in Spo0A activity at T3 as a function of IPTG with a PspoIIG-lacZ reporter (▪) match the predicted response of the graded phosphorelay (green curve) but not the bistable phosphorelay (purple curve). All values are normalized by the value at 0 μM IPTG. (D) In agreement with the graded phosphorelay model, single-cell measurements of GFP expression from the spoIIG promoter at T1 show no bimodality at either 4 μM or 10 μM IPTG and can be fit with gamma distributions (solid curves). a.u., arbitrary units.
Fig. 3.
Fig. 3.
σF activation overestimates the fraction of cells that sporulate. (A) Stochastic simulations of a mathematical model integrating phosphorelay and σF activation modules show ultrasensitive increases of σF in single cells as a function of IPTG (mean response, solid blue line; SD, shaded area; Hill equation fit, dashed black line). However, only a twofold increase in the mean active σF level is observed between 4 μM and 10 μM IPTG because σF activation has a low threshold (∼4 μM IPTG). Bimodal distributions of active σF level in the model (B, Upper) and in single-cell experiments with PspoIIQ-mCherry reporter (C, Upper) are shown. (B and C) Cumulative distributions (Lower) corresponding to the data (Upper) are shown (i.e., total fraction of cells with an active σF level below the given value). Threshold values separating two peaks (gray bars) are chosen to predict the fraction of cells that activate σF in D. a.u., arbitrary units. (D) Model predictions for fraction of sporulating cells based on the threshold of active σF level (black curve) are computed using the distributions for various IPTG levels and the threshold value shown in B. Experimental data (red triangle and green square for 4 μM and 10 μM, respectively) are obtained using the threshold and distributions in C. Fractions of σF-active cells computed from experimental and simulation data are in excellent agreement with one another, but both exceed observed spore fractions (purple dots; calculated from spore counts shown in Fig. 1D using Eq. 1 in Materials and Methods). (E) Examples of the microscopy data of strain MF3765 used to construct distributions in C. A significant fraction of cells show σF activity (measured by PspoIIQ-mCherry false-colored magenta forespore in the image) even at low IPTG concentrations (Left, 4 μM). This fraction increases at high IPTG (Right, 10 μM), but the increase is not ultrasensitive. Spo0A activity was measured by PspoIIG-gfp (green). The images show a field of view of 20 × 20 μm.
Fig. 4.
Fig. 4.
σE activation is the ultrasensitive switch that controls cell fate. (A) Stochastic simulations show that σE activation (mean response, solid black line; SD, shaded area) increases ultrasensitively in single cells as a function of IPTG and that this threshold coincides with the KinA threshold for sporulation. The mean active σE level increases ∼30-fold between 4 μM and 10 μM IPTG. Bimodal distributions of active σE in the model (B, Upper) and single-cell experiments (C, Upper) are shown. In C, PspoIID-gfp was used as a reporter to track the active σE level in single-cell experiments; fluorescence is shown in arbitrary units (a.u.). (B and C) Cumulative distributions (Lower) correspond to the data (Upper). Threshold values separating two peaks (vertical gray bars) are chosen to predict the fraction of cells that activate σE in D. (D) Model predictions for the fraction of sporulating cells based on the threshold of the active σE level (black curve) are computed using the distributions for various IPTG levels and the threshold value shown in B. Experimental data (red triangle and green square for 4 μM and 10 μM, respectively) are obtained using the threshold and distributions in C. Both experimental and computationally computed fractions of σE-active cells are in excellent agreement with the observed experimental spore fraction (purple dots; calculated from sporulation efficiency, same data as in Fig. 2C). (E) Examples of microscopy data of strain MF1957 used to construct distributions in C. Only a small fraction of cells show σE activity (green mother cell in the image) at low IPTG concentrations (Left, 4 μM). This fraction increases ultrasensitively at high IPTG (Right, 10 μM). The images show a field of view of 30 × 30 μm.
Fig. 5.
Fig. 5.
Ultrasensitivity and cell fate decision in WT cells. (A and B) Triple reporter strain (MF4859) was used to measure Spo0A and sigma factors activities simultaneously in WT cells grown in starvation media. Cells were binned based on CFP fluorescence for Spo0A activity (PspoIIA-cfp), and the fractions of cells in each bin that are σF-active and σE-active (based on appropriate PspoIIQ-mCherry and PspoIID-yfp fluorescence thresholds) are shown in A and B, respectively. The solid lines represent Hill equation fits. These fits indicate that fractions of cells displaying both σF and σE activities increase ultrasensitively at different Spo0A activity thresholds. (C and D) Time-lapse microscopy was used to track σF activities and cell fates in WT cells (MF1027) under starvation conditions. (C) Time-lapse trajectories of σF activity in cells that activate σF but fail to engulf the forespore and resume growth. (D) Time-lapse trajectories of σF activity in cells that activate σF, engulf the forespore, and form a phase-bright spore. Representative examples of cells that activate σF and fail to engulf (E) or successfully engulf and form a spore (F). σF activity (PspoIIQ-gfp) is false-colored magenta. Trajectories of σF activity for the specific cells shown in E and F are indicated by thick lines in C and D, respectively. All fluorescence intensities are reported in arbitrary units (a.u.). The images show a field of view of (E) 8 × 8 μm and (F) 10 × 10 μm.
Fig. P1.
Fig. P1.
(A) Sequence of morphological changes and activation of master-level transcriptional regulators in the course of starvation-induced sporulation in B. subtilis. 0A∼P, Spo0A∼P. (B) Ultrasensitive increase in the fraction of sporulating cells with isopropyl-β-d-thiogalactopyranoside (IPTG) induction in the ASI system (blue dots, 20-fold increase in the fraction of spores over a 2.5-fold increase in IPTG) matches an ultrasensitive σE activation predicted by an integrated mathematical model (black curve). Single-cell microscopy confirms that below and above the KinA threshold, cells display significant Spo0A activity (Upper Insets, green), form an asymmetrical septum, and activate σF (Upper Insets, magenta). However, the activation of σE (Lower Insets, green) only occurs above the KinA threshold (Right Insets, corresponding to 10 μM IPTG).

Similar articles

Cited by

References

    1. Errington J. Regulation of endospore formation in Bacillus subtilis. Nat Rev Microbiol. 2003;1(2):117–126. - PubMed
    1. Nicholson WL, Munakata N, Horneck G, Melosh HJ, Setlow P. Resistance of Bacillus endospores to extreme terrestrial and extraterrestrial environments. Microbiol Mol Biol Rev. 2000;64(3):548–572. - PMC - PubMed
    1. Errington J. Bacillus subtilis sporulation: Regulation of gene expression and control of morphogenesis. Microbiol Rev. 1993;57(1):1–33. - PMC - PubMed
    1. Fawcett P, Eichenberger P, Losick R, Youngman P. The transcriptional profile of early to middle sporulation in Bacillus subtilis. Proc Natl Acad Sci USA. 2000;97(14):8063–8068. - PMC - PubMed
    1. Eichenberger P, et al. The sigmaE regulon and the identification of additional sporulation genes in Bacillus subtilis. J Mol Biol. 2003;327(5):945–972. - PubMed

Publication types

LinkOut - more resources