. 2012 Dec 4;109(49):20071-6.
doi: 10.1073/pnas.1206360109. Epub 2012 Nov 19.

Combination of glycolysis inhibition with chemotherapy results in an antitumor immune response

Affiliations

Combination of glycolysis inhibition with chemotherapy results in an antitumor immune response

Marie Bénéteau et al. Proc Natl Acad Sci U S A. .

Abstract

Most DNA-damaging agents are weak inducers of an anticancer immune response. Increased glycolysis is one of the best-described hallmarks of tumor cells; therefore, we investigated the impact of glycolysis inhibition, using 2-deoxyglucose (2DG), in combination with cytotoxic agents on the induction of immunogenic cell death. We demonstrated that 2DG synergized with etoposide-induced cytotoxicity and significantly increased the life span of immunocompetent mice but not immunodeficient mice. We then established that only cotreated cells induced an efficient tumor-specific T-cell activation ex vivo and that tumor antigen-specific T cells could only be isolated from cotreated animals. In addition, only when mice were immunized with cotreated dead tumor cells could they be protected (vaccinated) from a subsequent challenge using the same tumor in viable form. Finally, we demonstrated that this effect was at least partially mediated through ERp57/calreticulin exposure on the plasma membrane. These data identify that the targeting of glycolysis can convert conventional tolerogenic cancer cell death stimuli into immunogenic ones, thus creating new strategies for immunogenic chemotherapy.


Conflict of interest statement

The authors declare no conflict of interest.

Figures

Fig. 1.
Fig. 1.
Glycolysis inhibition synergizes with etoposide treatment to induce cell death in vitro. (A) Primary Eμ-Myc lymphoma cells were incubated for 20 h with either the indicated amount of etoposide (empty bars) or etoposide plus 2DG (100 μg/mL; black bars). The percentage of PI-positive cells was measured by flow cytometry. The predicted additive effect is represented in gray. (B) Eμ-Myc cells were treated as indicated for 6 h with or without 100 μg/mL 2DG, and specific DEVDase activity was measured. (C) XTT-derived isobolograms representing the concentration of each product leading to the indicated effect after a 20-h incubation (the number indicated on the top right part indicates the percentage of viable cells: 40 indicates 40% of viable cells in the XTT test). Results represent the mean ± SD of three independent experiments. PI, Propidium iodide; 2DG, 2-deoxyglucose; ETO, etoposide. **P < 0.01, ***P < 0.001.
Fig. 2.
Fig. 2.
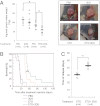
Glycolysis inhibition enhances the therapeutic benefit of chemotherapy in vivo. (A) C57BL/6 mice bearing Eμ-Myc lymphomas were injected thrice a week for 3 wk as soon as the lymph nodes became palpable with 2DG (500 mg/kg), ETO (2.5 mg/kg), or the combination. Harvested lymph nodes were measured after the third week of treatment. The left panel represents the inguinal lymph node weights. Images illustrating the protective effect of the cotreatment are presented on the right panel. (Scale bar, 1 cm.) (B) Kaplan–Meier survival curves of mice treated for 3 wk as in A. Vehicle-treated mice (blue line), 2DG (brown line), etoposide alone (orange line), and the combination (green line) are shown (n = 10 mice/group). (C) Mice were treated as in A and the time of relapse was measured. 2DG, 2-deoxyglucose; ETO, etoposide. *P < 0.05, **P < 0.01. Experiments were done twice leading to similar results.
Fig. 3.
Fig. 3.
Cotreatment leads to tumor-specific T-cell activation. (A) Nude mice were injected (i.v.) with 0.5 million Eμ-Myc cells and treated as in Fig. 2 (n = 5 for 2DG, n = 6 for ETO or ETO-plus-2DG groups). (B) C57BL/6 lymphoma-bearing mice were treated as in Fig. 2 for 1 wk. The number of T cells isolated from axillary lymph nodes was analyzed by flow cytometry (n = 9 mice/group). (C) Same as in B, measuring the number of CD8+ cells (n = 9 mice/group). (D) Primary Eμ-Myc lymphoma cells treated for 24 h with 2DG (100 μg/mL), etoposide (30 ng/mL), or both were incubated with C57BL/6 monocyte-derived DCs and then cocultured with naïve syngeneic T cells. Ten days later, the quantification of IFN-γ–producing T cells upon tumor antigen presentation was determined by ELISPOT. (E and F) C57BL/6 lymphoma-bearing mice were treated as in Fig. 2 for 1 wk, and then CD8+ cells were isolated from the spleens of three independent mice and incubated with Eμ-Myc primary cells. The ability of CD8+ cells to kill Eμ-Myc cells was determined using LDH measurement. The ratio of CD8+:Eμ-Myc cells is indicated. Results represent the mean ± SD of three independent experiments and in vivo experiments were done twice. 2DG, 2-deoxyglucose; ETO, etoposide; NT, not treated. *P < 0.05, **P < 0.01.
Fig. 4.
Fig. 4.
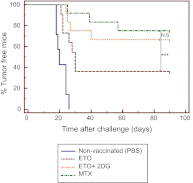
Glycolysis inhibition enhances the vaccination potential of chemotherapy. Kaplan–Meier curve of a vaccination experiment. CT26 cells were treated for 48 h with etoposide (1 μg/mL), etoposide plus 2DG (100 μg/mL), mitoxantrone (1 μM), or PBS and injected s.c. on syngeneic BALB/c mouse flanks. One week later, live cells were injected into the opposite flank, and tumor appearance was monitored over time (n = 7 for nonvaccinated group and n = 12 for other groups). 2DG, 2-deoxyglucose; ETO, etoposide; MTX, mitoxantrone; N.S., nonsignificant. ***P < 0.001. Experiments were done twice, leading to similar results.
Fig. 5.
Fig. 5.
Cotreatment leads to ER stress and an increase in calreticulin exposure. (A) CT26 cells were treated with 2DG (100 μg/mL) for 16 h. The phosphorylated or the total form of eIF2α was detected by immunoblotting. (Right) Quantification of densitometric analysis of three independent experiments. (B) CRT exposure was determined by flow cytometry analysis after incubation of CT26 with the indicated agents for 24 h (100 μg/mL 2DG, 1 μg/mL etoposide, 1 μM mitomycin c, and 1 μM mitoxantrone). The results represent the mean ± SD of three independent experiments. 2DG, 2-deoxyglucose; CRT, calreticulin. *P < 0.05. NT, Not treated.
Fig. 6.
Fig. 6.
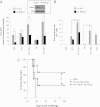
Calreticulin exposure is involved in the induction of tumor antigen-specific T-cell response. (A) CT26 stably expressing sh scramble or shERp57 (knockdown as shown by immunoblotting in Inset; ERK was used a loading control) were treated as indicated and as in Fig. 5B for 24 h, and CRT exposure at the plasma membrane was determined by flow cytometry analysis. (B) IFN-γ–producing cells were measured as in Fig. 3D using CT26 cells expressing a control shRNA (shScr) or a shRNA targeting ERp57 (shERp57) (100 μg/mL 2DG, 1 μg/mL etoposide, 1 μM mitomycin c, 1 μM mitoxantrone). (C) Vaccination experiments are as in Fig. 4 using control (shSrc) or shERp57 CT26 cells treated with mitomycin c (1 μM) plus 2DG (100 μg/mL) for 48 h (n = 12 mice/group). Experiments were done twice leading to similar results. 2DG, 2-deoxyglucose; ETO, etoposide; Mc, mitomycin c; MTX, mitoxantrone; Scr, Scramble. *P < 0.05, **P < 0.01, ***P < 0.001. The results in A and B represent the mean ± SD of three independent experiments.

Similar articles

Cited by

References

    1. Vander Heiden MG. Targeting cancer metabolism: A therapeutic window opens. Nat Rev Drug Discov. 2011;10(9):671–684. - PubMed
    1. Muñoz-Pinedo C, El Mjiyad N, Ricci JE. Cancer metabolism: Current perspectives and future directions. Cell Death Dis. 2012;3:e248. - PMC - PubMed
    1. El Mjiyad N, Caro-Maldonado A, Ramírez-Peinado S, Muñoz-Pinedo C. Sugar-free approaches to cancer cell killing. Oncogene. 2011;30(3):253–264. - PubMed
    1. Kurtoglu M, et al. Under normoxia, 2-deoxy-D-glucose elicits cell death in select tumor types not by inhibition of glycolysis but by interfering with N-linked glycosylation. Mol Cancer Ther. 2007;6(11):3049–3058. - PubMed
    1. Ralser M, et al. A catabolic block does not sufficiently explain how 2-deoxy-D-glucose inhibits cell growth. Proc Natl Acad Sci USA. 2008;105(46):17807–17811. - PMC - PubMed

Publication types