

Exercise-induced bronchoconstriction: reproducibility of hyperpolarized 3He MR imaging
- PMID: 23169798
- PMCID: PMC5411018
- DOI: 10.1148/radiol.12111973
Exercise-induced bronchoconstriction: reproducibility of hyperpolarized 3He MR imaging
Abstract
Purpose: To quantitatively evaluate interday, interreader, and intersite agreement of readers of hyperpolarized helium 3 (HPHe) MR images in patients with exercise-induced bronchoconstriction.
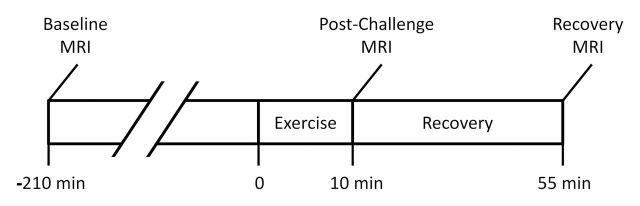
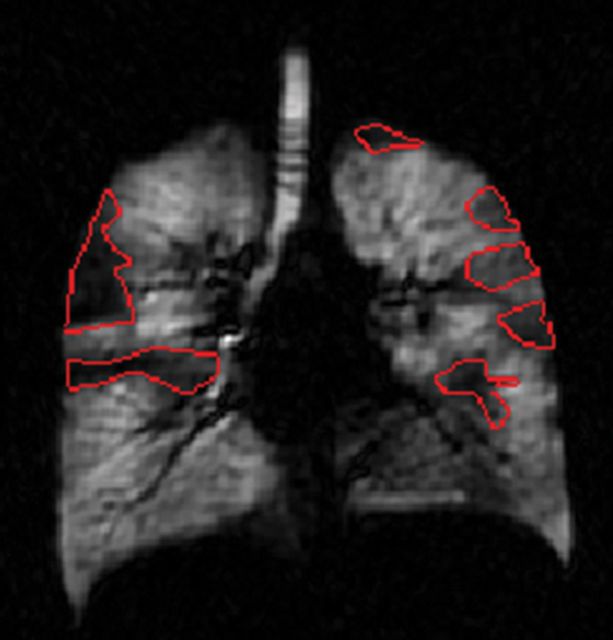
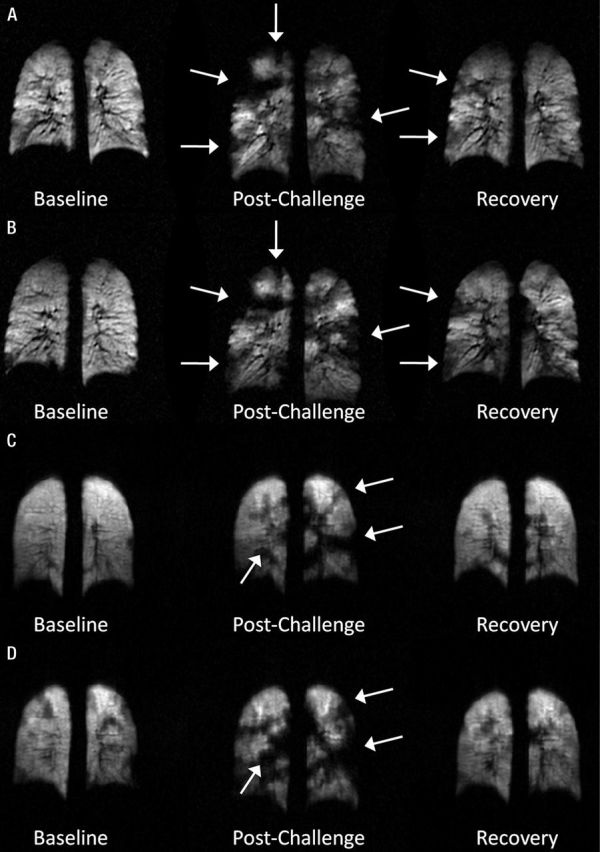
Materials and methods: This HIPAA-compliant, institutional review board approved study included 13 patients with exercise-induced bronchoconstriction. On two separate days, HPHe MR imaging of the lungs was performed at baseline, immediately after a 10-minute exercise challenge (postchallenge), and 45 minutes after exercise (recovery). Patients were imaged at two sites, six at site A and seven at site B. Images were analyzed independently by multiple readers at each site. Lung volume, ventilation defect volume, ventilated volume, and the number of defects were measured quantitatively, and the location of defects was evaluated qualitatively at site A. Interday and interreader agreement were evaluated by using the intraclass correlation coefficient (ICC), and intersite agreement was evaluated by using a modified Bland-Altman analysis.
Results: The ICC between days for ventilation defect volume, ventilated volume, and number of defects was at least 0.74 at both sites. The ICC for lung volume was greater at site B (0.83-0.86) than at site A (0.60-0.65). Defects seen in the same location in the lung on both days included 19.7% of those seen on baseline images and 29.2% and 18.6% of defects on postchallenge and recovery images, respectively. Interreader ICC for each measurement was at least 0.82 for each site. Analysis of intersite agreement showed biases of 612 mL for lung volume, -60.7 mL for ventilation defect volume, 2.91% for ventilated volume, and -6.56 for number of defects.
Conclusion: The reported measures of reproducibility of HPHe MR imaging may help in the design and interpretation of single- and multicenter studies of patients with exercise-induced bronchoconstriction.
Figures


References
-
- McFadden ER, Gilbert IA. Exercise-induced asthma. N Engl J Med 1994;330(19):1362–1367. - PubMed
-
- Billen A, Dupont L. Exercise induced bronchoconstriction and sports. Postgrad Med J 2008;84(996):512–517. - PubMed
-
- Samee S, Altes T, Powers P, et al. . Imaging the lungs in asthmatic patients by using hyperpolarized helium-3 magnetic resonance: assessment of response to methacholine and exercise challenge. J Allergy Clin Immunol 2003;111(6):1205–1211. - PubMed
-
- Brudno DS, Wagner JM, Rupp NT. Length of postexercise assessment in the determination of exercise-induced bronchospasm. Ann Allergy 1994;73(3):227–231. - PubMed
-
- Godfrey S, Silverman M, Anderson SD. The use of the treadmill for assessing exercise-induced asthma and the effect of varying the severity and duration of exercise. Pediatrics 1975;56(5 pt-2 suppl):893–898. - PubMed
Publication types
MeSH terms
Substances
Grants and funding
LinkOut - more resources
Full Text Sources
Other Literature Sources
Medical
