Comparative Study
. 2013 Jan;19(1):51-62.
doi: 10.1261/rna.034710.112. Epub 2012 Nov 20.

Systematic evaluation of medium-throughput mRNA abundance platforms

Affiliations
Comparative Study

Systematic evaluation of medium-throughput mRNA abundance platforms

Stephenie D Prokopec et al. RNA. 2013 Jan.

Abstract

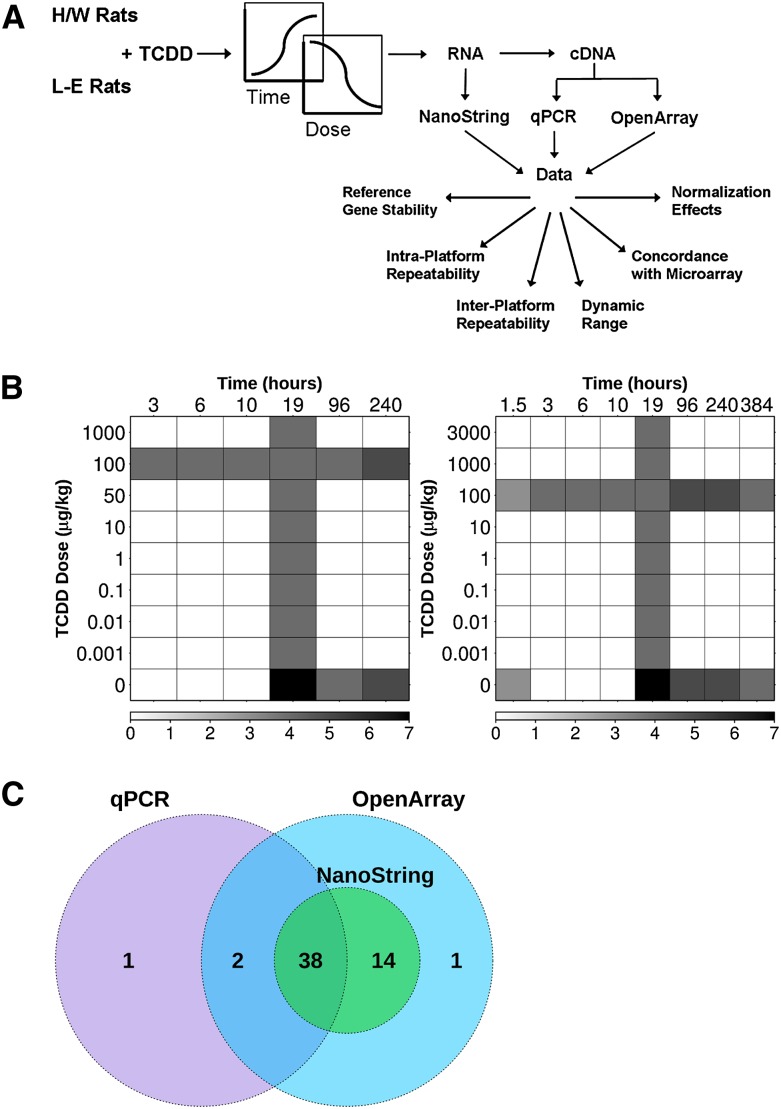
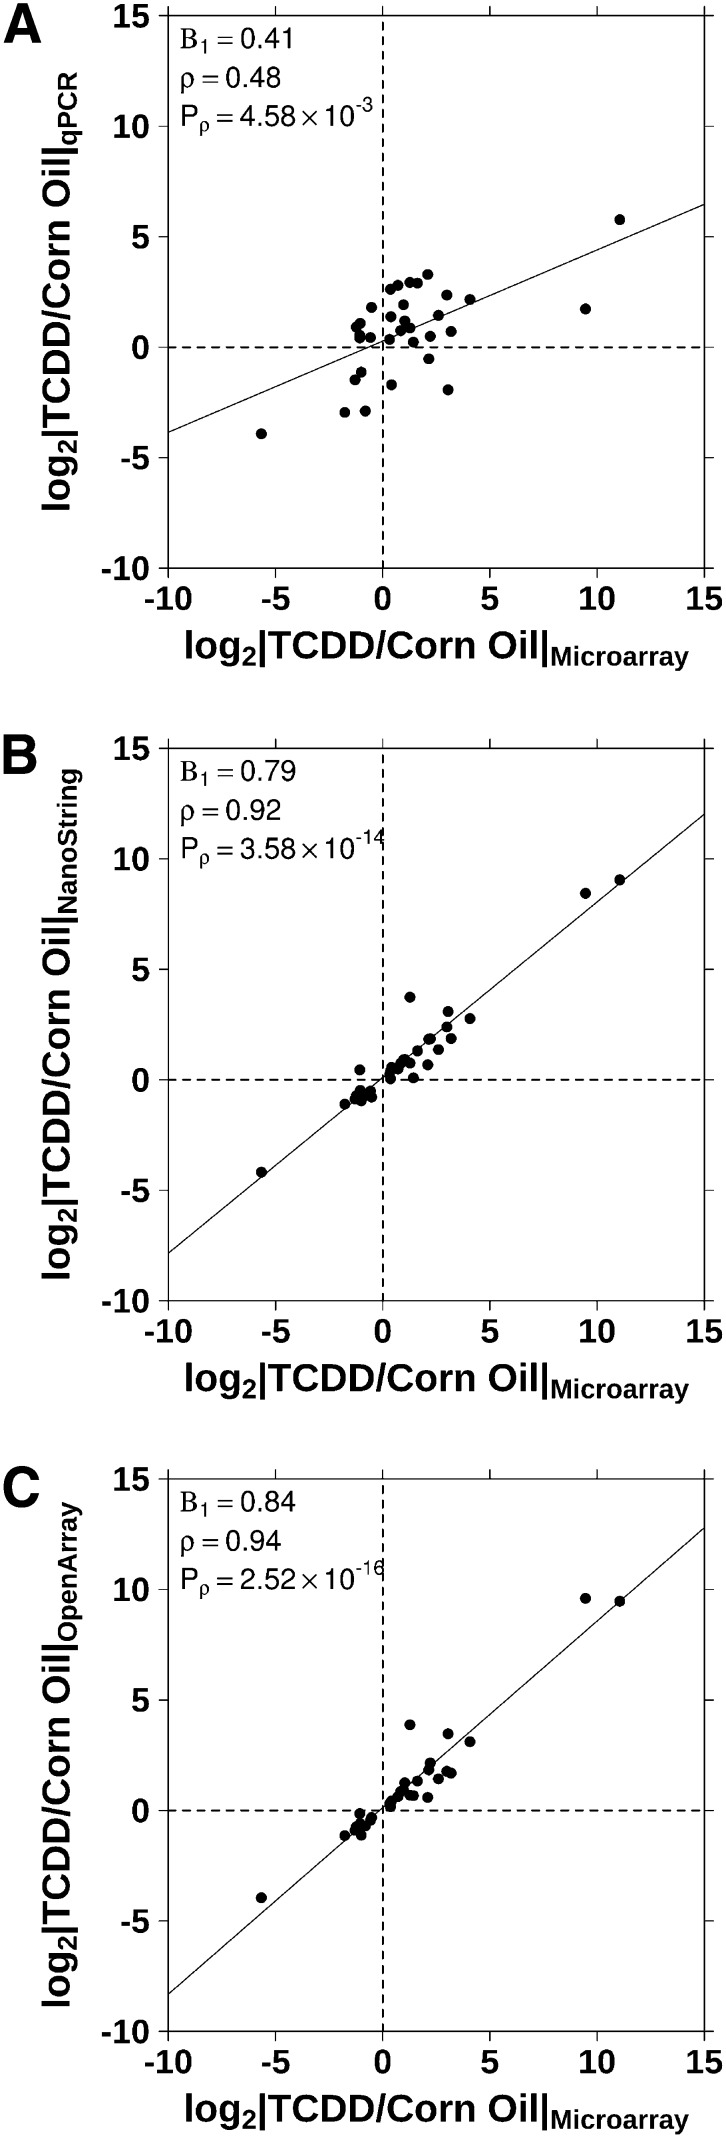
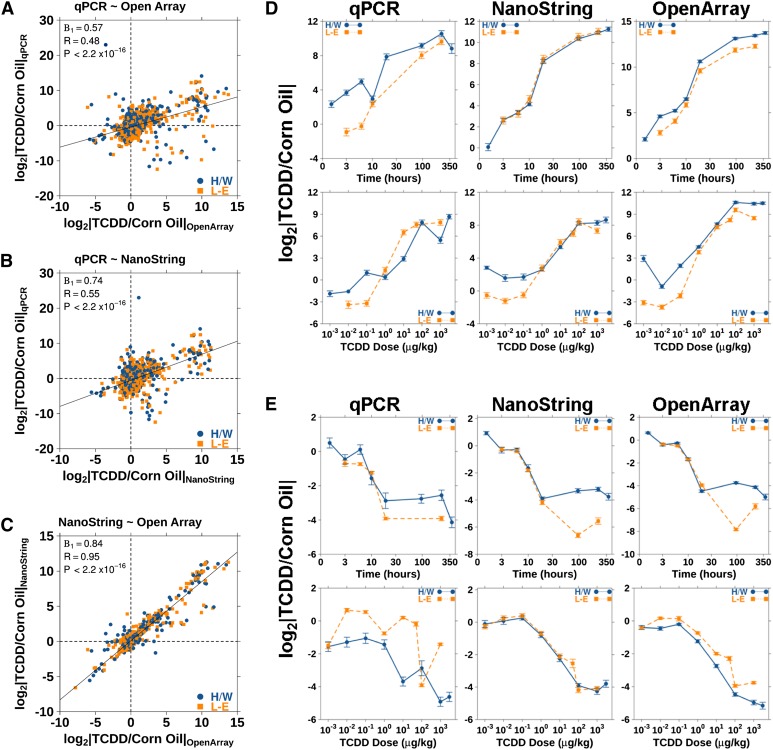
Profiling of mRNA abundances with high-throughput platforms such as microarrays and RNA-seq has become an important tool in both basic and biomedical research. However, these platforms remain prone to systematic errors and have challenges in clinical and industrial applications. As a result, it is standard practice to validate a subset of key results using alternate technologies. Similarly, clinical and industrial applications typically involve transitions from a high-throughput discovery platform to medium-throughput validation ones. These medium-throughput validation platforms have high technical reproducibility and reduced sample input needs, and low sensitivity to sample quality (e.g., for processing FFPE specimens). Unfortunately, while medium-throughput platforms have proliferated, there are no comprehensive comparisons of them. Here we fill that gap by comparing two key medium-throughput platforms--NanoString's nCounter Analysis System and ABI's OpenArray System--to gold-standard quantitative real-time RT-PCR. We quantified 38 genes and positive and negative controls in 165 samples. Signal:noise ratios, correlations, dynamic range, and detection accuracy were compared across platforms. All three measurement technologies showed good concordance, but with divergent price/time/sensitivity trade-offs. This study provides the first detailed comparison of medium-throughput RNA quantification platforms and provides a template and a standard data set for the evaluation of additional technologies.


Figures

FIGURE 1.
FIGURE 1.
(A) Outline of the experimental design and workflow for this study from animal treatment to data analysis. (B) Graphical representation of the TCDD dose (in micrograms per kilogram, μg/kg) and the time of collection for Long-Evans (left panel) and Han/Wistar (right panel) rats. The dose–response study was performed on tissues collected at 19 h (vertical bar), while the time-course study was performed using a dose of 100 μg/kg (horizontal bar). The number of animals included in each group is indicated by the gradient. (C) mRNA levels for 38 genes were measured across all three platforms.
FIGURE 2.
FIGURE 2.
The reference genes used for the NanoString and OpenArray RT-PCR analyses were validated before downstream analysis. (A) The Pearson's correlations between each of the reference genes presented as a heatmap as analyzed by NanoString or (B) OpenArray. (C) The time-course response of the reference gene mRNA levels following TCDD treatment (100 μg/kg) as determined using NanoString or (D) OpenArray.
FIGURE 3.
FIGURE 3.
Fold changes from each platform were plotted against fold changes calculated using microarray data from a previous study for the genes evaluated on all platforms (Boutros et al. 2008). Fold changes measured through (A) qPCR analysis show a lower correlation with the microarray study than either (B) NanoString or (C) OpenArray as indicated by the low Spearman's correlation (ρ).
FIGURE 4.
FIGURE 4.
Fold changes for genes common to all platforms were compared with measure interplatform performance. (A) Pearson's correlations were calculated for the comparison between qPCR and OpenArray, (B) qPCR and NanoString, and (C) NanoString and OpenArray. The time-course and dose–response plots for two well-known TCDD-regulated genes, (D) Cyp1b1 and (E) Inmt, were created and compared across all platforms.
FIGURE 5.
FIGURE 5.
NanoString Technologies suggests numerous methods for normalization of the mRNA counts. We compared variations of our initial method to determine whether or not the correlation with our qPCR data could be improved. (A) Our initial normalization involved using only the positive control counts and reference gene counts. Alternate methods analyzed include (B) using only the positive control counts, (C) adding the quantile distribution method to the method in A, (D,E) adding various background noise subtraction methods—either the mean or maximum background count was subtracted—to A, and (F) using a different positive control count normalization.

References

    1. Altschul SF, Gish W, Miller W, Myers EW, Lipman DJ 1990. Basic local alignment search tool. J Mol Biol 215: 403–410 - PubMed
    1. Barsyte-Lovejoy D, Lau SK, Boutros PC, Khosravi F, Jurisica I, Andrulis IL, Tsao MS, Penn LZ 2006. The c-Myc oncogene directly induces the H19 noncoding RNA by allele-specific binding to potentiate tumorigenesis. Cancer Res 66: 5330–5337 - PubMed
    1. Bolstad BM, Irizarry RA, Astrand M, Speed TP 2003. A comparison of normalization methods for high density oligonucleotide array data based on variance and bias. Bioinformatics 19: 185–193 - PubMed
    1. Boutros PC, Yan R, Moffat ID, Pohjanvirta R, Okey AB 2008. Transcriptomic responses to 2,3,7,8-tetrachlorodibenzo-p-dioxin (TCDD) in liver: Comparison of rat and mouse. BMC Genomics 9: 419 doi: 10.1186/1471-2164-9-419 - PMC - PubMed
    1. Boutros PC, Lau SK, Pintilie M, Liu N, Shepherd FA, Der SD, Tsao MS, Penn LZ, Jurisica I 2009. Prognostic gene signatures for non-small-cell lung cancer. Proc Natl Acad Sci 106: 2824–2828 - PMC - PubMed

Publication types

MeSH terms

Substances