

Case/control studies with follow-up: Constructing the source population to estimate effects of risk factors on development, disease, and survival
- PMID: 23169939
- PMCID: PMC3502318
- DOI: 10.1093/cid/cis802
Case/control studies with follow-up: Constructing the source population to estimate effects of risk factors on development, disease, and survival
Abstract
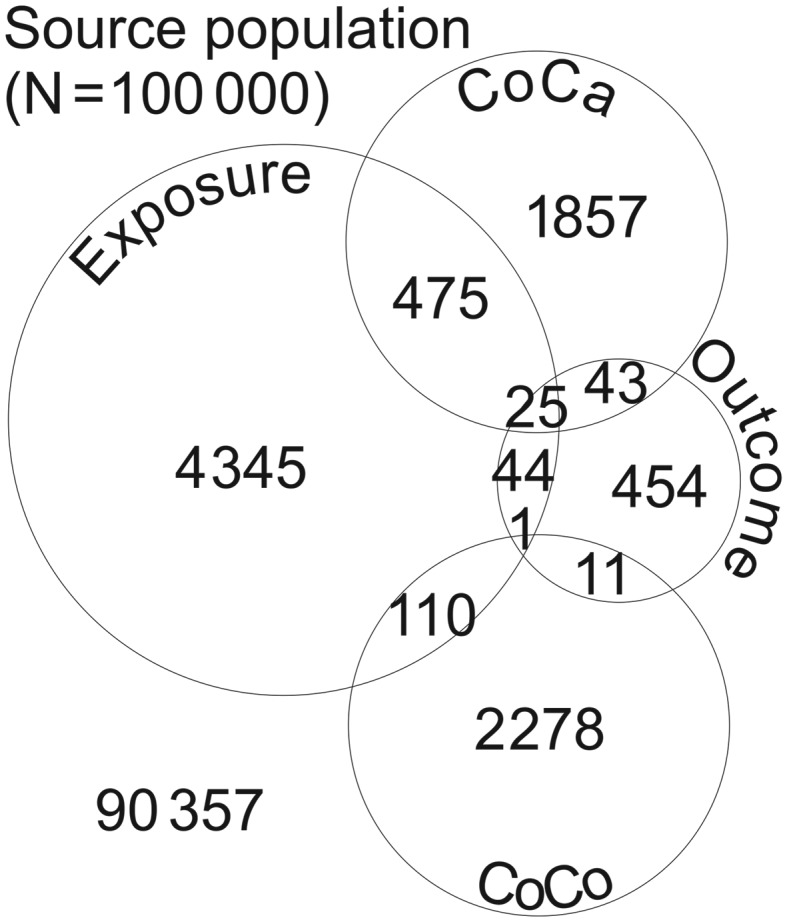
If individuals in a case/control study are subsequently observed as a cohort of cases and a cohort of controls, weighted regression analyses can be used to estimate the association between the exposures initially recorded and events occurring during the follow-up of the 2 cohorts. Such analyses can be conceptualized as being undertaken on a reconstructed source population from which cases and controls stem. To simulate this population, the cohort of cases is added to the cohort of controls expanded with the reciprocal of the case disease incidence odds (the sampling weight) to include all individuals in the source population who did not develop the case disease. We use a simulated dataset to illustrate how weighted generalized linear model regression can be used to estimate the association between an exposure captured during the case/control study component and an outcome that occurs during follow-up.
Figures
Similar articles
-
Effects of long-term exposure to traffic-related air pollution on respiratory and cardiovascular mortality in the Netherlands: the NLCS-AIR study.Res Rep Health Eff Inst. 2009 Mar;(139):5-71; discussion 73-89. Res Rep Health Eff Inst. 2009. PMID: 19554969
-
The importance of distinguishing between the odds ratio and the incidence rate ratio in GWAS.BMC Med Genet. 2015 Aug 30;16:71. doi: 10.1186/s12881-015-0210-1. BMC Med Genet. 2015. PMID: 26319230 Free PMC article.
-
A simulation study of control sampling methods for nested case-control studies of genetic and molecular biomarkers and prostate cancer progression.Cancer Epidemiol Biomarkers Prev. 2009 Mar;18(3):706-11. doi: 10.1158/1055-9965.EPI-08-0839. Epub 2009 Mar 3. Cancer Epidemiol Biomarkers Prev. 2009. PMID: 19258478
-
Impact numbers: measures of risk factor impact on the whole population from case-control and cohort studies.J Epidemiol Community Health. 2002 Aug;56(8):606-10. doi: 10.1136/jech.56.8.606. J Epidemiol Community Health. 2002. PMID: 12118052 Free PMC article. Review.
-
Empirical approaches to risk estimation and prediction.IARC Sci Publ. 1999;(131):131-78. IARC Sci Publ. 1999. PMID: 10505296 Review. No abstract available.
Cited by
-
Statistical methods in the Global Enteric Multicenter Study (GEMS).Clin Infect Dis. 2012 Dec;55 Suppl 4(Suppl 4):S246-53. doi: 10.1093/cid/cis788. Clin Infect Dis. 2012. PMID: 23169937 Free PMC article.
-
Antenatal Uterotonics as a Risk Factor for Intrapartum Stillbirth and First-day Death in Haryana, India: A Nested Case-control Study.Epidemiology. 2020 Sep;31(5):668-676. doi: 10.1097/EDE.0000000000001224. Epidemiology. 2020. PMID: 32618713 Free PMC article. Clinical Trial.
-
Caregiver responses and association with delayed care-seeking in children with uncomplicated and severe malaria.Malar J. 2018 Dec 18;17(1):476. doi: 10.1186/s12936-018-2630-9. Malar J. 2018. PMID: 30563514 Free PMC article.
-
Demographic, Socioeconomic, and Geographic Factors Leading to Severe Malaria and Delayed Care Seeking in Ugandan Children: A Case-Control Study.Am J Trop Med Hyg. 2017 Nov;97(5):1513-1523. doi: 10.4269/ajtmh.17-0056. Epub 2017 Oct 10. Am J Trop Med Hyg. 2017. PMID: 29016322 Free PMC article.
-
Number of teeth, C-reactive protein, fibrinogen and cardiovascular mortality: a 15-year follow-up study in a Finnish cohort.J Clin Periodontol. 2014 Feb;41(2):131-40. doi: 10.1111/jcpe.12192. Epub 2013 Dec 10. J Clin Periodontol. 2014. PMID: 24354534 Free PMC article.
References
-
- Breslow NE. Statistics in epidemiology: the case-control study. J Am Stat Assoc. 1996;91:14–28. - PubMed
-
- Rothman KJ. Epidemiology: an introduction. 2nd ed. New York, NY: Oxford University Press; 2012.
-
- Rothman KJ, Greenland S, Lash TL. Modern epidemiology. 3rd ed. Philadelphia: Wolters Kluwer Health/Lippincott Williams & Wilkins; 2008.
-
- Nagelkerke N, Smits J, le Cessie S, van Houwelingen H. Testing goodness-of-fit of the logistic regression model in case-control studies using sample reweighting. Stat Med. 2005;24:121–30. - PubMed
-
- Richardson DB, Rzehak P, Klenk J, Weiland SK. Analyses of case-control data for additional outcomes. Epidemiology. 2007;18:441–5. - PubMed
