

Gene flow on ice: the role of sea ice and whaling in shaping Holarctic genetic diversity and population differentiation in bowhead whales (Balaena mysticetus)
- PMID: 23170222
- PMCID: PMC3501639
- DOI: 10.1002/ece3.397
Gene flow on ice: the role of sea ice and whaling in shaping Holarctic genetic diversity and population differentiation in bowhead whales (Balaena mysticetus)
Abstract
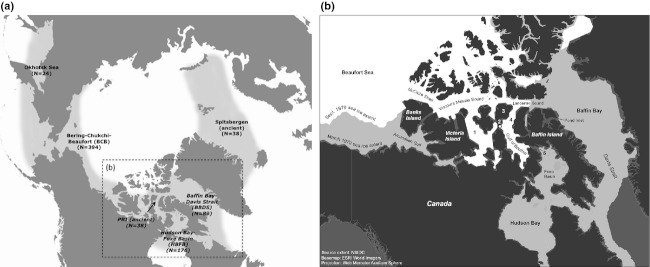
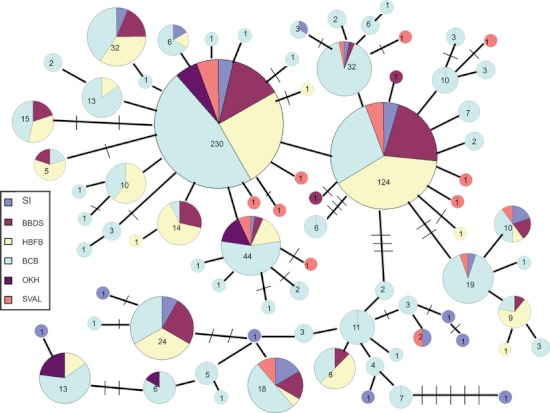
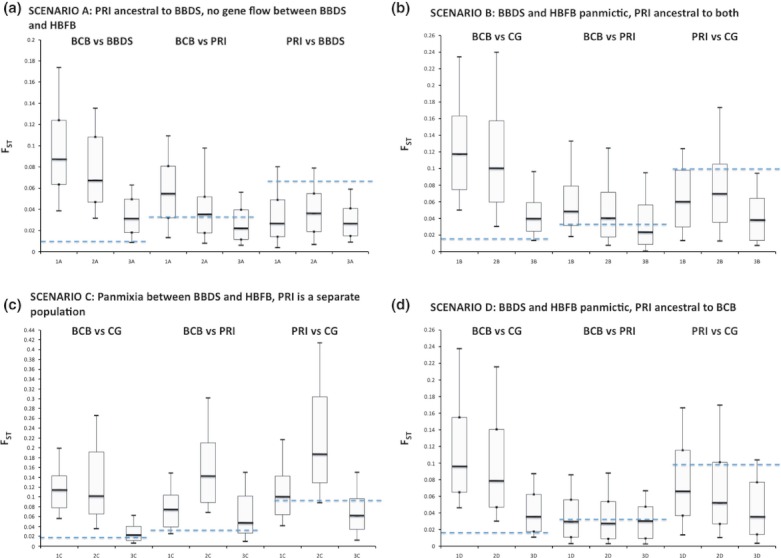
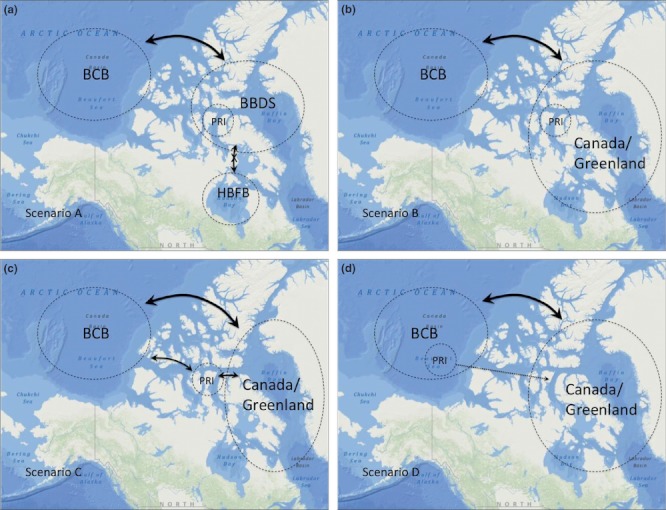
Sea ice is believed to be a major factor shaping gene flow for polar marine organisms, but it remains unclear to what extent it represents a true barrier to dispersal for arctic cetaceans. Bowhead whales are highly adapted to polar sea ice and were targeted by commercial whalers throughout Arctic and subarctic seas for at least four centuries, resulting in severe reductions in most areas. Both changing ice conditions and reductions due to whaling may have affected geographic distribution and genetic diversity throughout their range, but little is known about range-wide genetic structure or whether it differed in the past. This study represents the first examination of genetic diversity and differentiation across all five putative stocks, including Baffin Bay-Davis Strait, Hudson Bay-Foxe Basin, Bering-Beaufort-Chukchi, Okhotsk, and Spitsbergen. We also utilized ancient specimens from Prince Regent Inlet (PRI) in the Canadian Arctic and compared them with modern stocks. Results from analysis of molecular variance and demographic simulations are consistent with recent and high gene flow between Atlantic and Pacific stocks in the recent past. Significant genetic differences between ancient and modern populations suggest PRI harbored unique maternal lineages in the past that have been recently lost, possibly due to loss of habitat during the Little Ice Age and/or whaling. Unexpectedly, samples from this location show a closer genetic relationship with modern Pacific stocks than Atlantic, supporting high gene flow between the central Canadian Arctic and Beaufort Sea over the past millennium despite extremely heavy ice cover over much of this period.
Keywords: Ancient DNA; arctic; cetacean; marine mammal; mitochondrial DNA; whaling.
Figures
References
-
- Alter SE, Palumbi SR. Comparing evolutionary patterns and variability in the mitochondrial control region and cytochrome b in three species of Baleen whales. J. Mol. Evol. 2009;68:97–111. - PubMed
-
- Alter SE, Ramirez SF, Nigenda S, Urban Ramirez J, Bracho LR, Palumbi SR. Mitochondrial and nuclear genetic variation across calving lagoons in eastern North Pacific gray whales (Eschrichtius robustus. J. Hered. 2009;100:34–46. - PubMed
-
- Alter SE, Newsome S, Palumbi SR. Pre-whaling genetic diversity and population ecology in eastern Pacific gray whales: insights from ancient DNA and stable isotopes. PLoS ONE. 2012;7:e35039. doi: 10.1371/journal.pone.0035039. - DOI - PMC - PubMed
-
- Anderson CNK, Ramakrishnan U, Chan YL, Hadly EA. Serial SimCoal: a population genetic model for data from multiple populations and points in time. Bioinformatics. 2005;21:1733–1734. - PubMed
LinkOut - more resources
Full Text Sources
Miscellaneous
