. 2012 Nov;2(6):763-77.
doi: 10.1002/brb3.91. Epub 2012 Sep 29.

Two critical periods in early visual cortex during figure-ground segregation

Affiliations

Two critical periods in early visual cortex during figure-ground segregation

Martijn E Wokke et al. Brain Behav. 2012 Nov.

Abstract

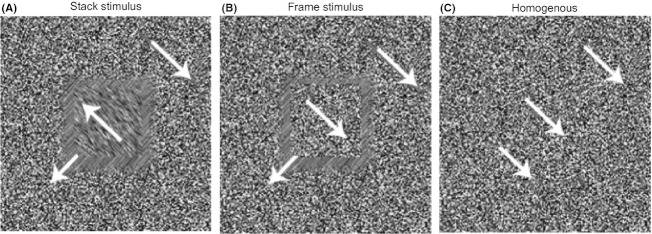
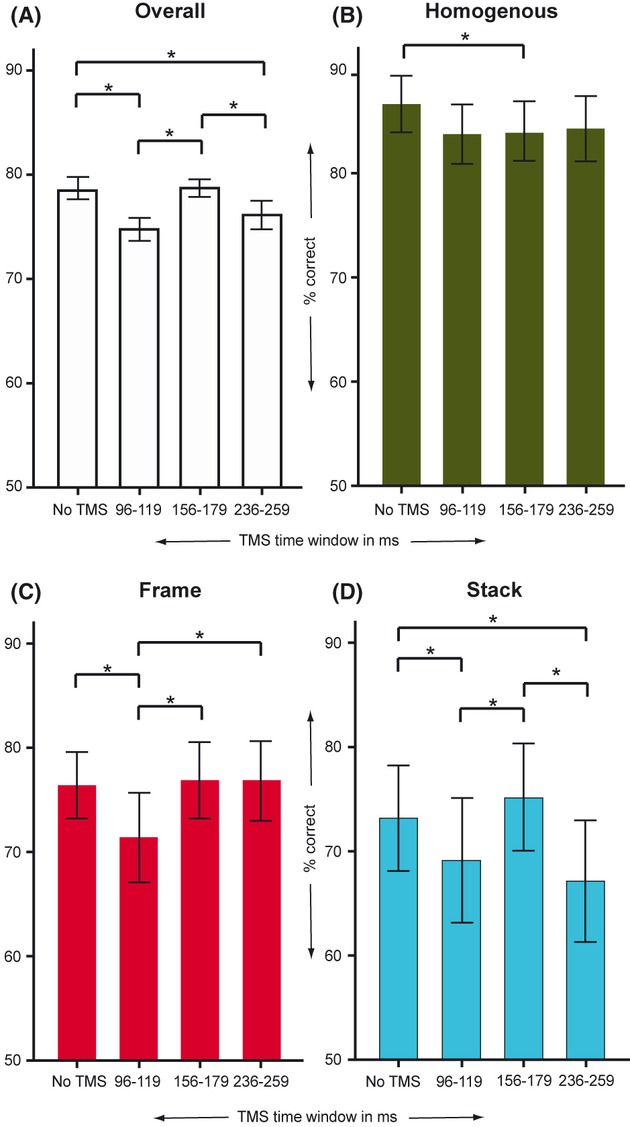
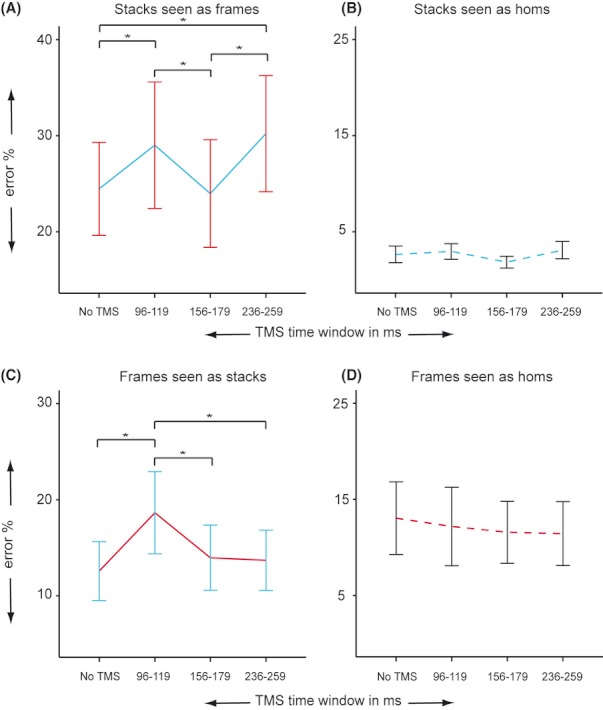
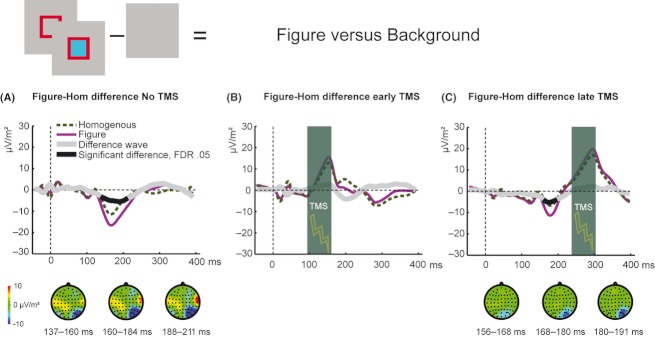
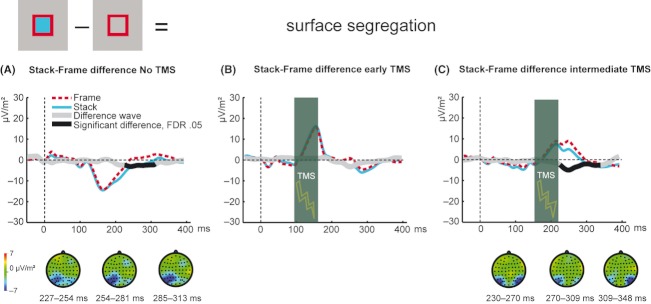
The ability to distinguish a figure from its background is crucial for visual perception. To date, it remains unresolved where and how in the visual system different stages of figure-ground segregation emerge. Neural correlates of figure border detection have consistently been found in early visual cortex (V1/V2). However, areas V1/V2 have also been frequently associated with later stages of figure-ground segregation (such as border ownership or surface segregation). To causally link activity in early visual cortex to different stages of figure-ground segregation, we briefly disrupted activity in areas V1/V2 at various moments in time using transcranial magnetic stimulation (TMS). Prior to stimulation we presented stimuli that made it possible to differentiate between figure border detection and surface segregation. We concurrently recorded electroencephalographic (EEG) signals to examine how neural correlates of figure-ground segregation were affected by TMS. Results show that disruption of V1/V2 in an early time window (96-119 msec) affected detection of figure stimuli and affected neural correlates of figure border detection, border ownership, and surface segregation. TMS applied in a relatively late time window (236-259 msec) selectively deteriorated performance associated with surface segregation. We conclude that areas V1/V2 are not only essential in an early stage of figure-ground segregation when figure borders are detected, but subsequently causally contribute to more sophisticated stages of figure-ground segregation such as surface segregation.

Keywords: EEG; TMS; V1/V2; scene segmentation; visual perception.


Figures

Figure 1
Figure 1
(A–C) Stimuli were created by displacing randomly distributed black-and-white dots in one of the four directions. The three stimuli differed in the amount of figure regions segregated from the background. Animated versions of the stimuli are visible by clicking on the stimulus.
Figure 2
Figure 2
(A) Task design. Participants had to discriminate between a “stack,” “frame,” or “homogenous” stimulus. Crucially, these three stimuli differed in the amount of figure–ground segregation needed to make a correct distinction. The stimulus was presented at the lower left side of the fixation dot. Importantly, after stimulus presentation, we briefly disrupted V1/V2 at various moments after stimulus presentation with two TMS pulses (intermixed with trials without TMS) while recording EEG signals. (B) TMS target location.
Figure 3
Figure 3
(A) Overall detection scores per transcranial magnetic stimulation (TMS) condition show that performance was affected depending on timing of TMS and stimulus type. (B) TMS in general, not timing specific, seemed to disrupt detection of homogeneous stimuli. (C) Frame detection decreased selectively when TMS was applied in an early time window. (D) Detection of stack stimuli was deteriorated when TMS was applied in this same early time window, but also later in time again in the late TMS condition. Data are means ± SEM.
Figure 4
Figure 4
Types of errors are plotted for stacks and frames for the different transcranial magnetic stimulation (TMS) conditions. When TMS was applied in an early time window, stacks and frames are more frequently being mixed up (A and C). When TMS was applied in a late time window selectively stacks are being more often seen as frames (A). TMS has no influence on the amount of stacks seen as homogenous (B) or frames seen as homogenous (D). Data are means ± SEM.
Figure 5
Figure 5
EEG–TMS results: early and late stages in figure–ground segregation. (A) Figure stimuli deflected negatively from homogenous stimuli when no TMS was applied (significant interval = 137–211 msec, P < 0.05, corrected for multiple comparison with the FDR) or (C) when TMS was applied in a late time window (significant interval = 156–191 msec, P < 0.05, corrected for multiple comparison with the FDR). This significant deflection was abolished when TMS was applied in an early time window (B). Signals behind the transparent vertical bar represent interpolated data. ERPs are computed for a cluster of peri-occipital electrodes (O1, O2, Oz, POz, PO3, PO4, PO5, PO6, PO7, and PO8).
Figure 6
Figure 6
EEG–TMS results: late stage in figure–ground segregation. (A) Stack stimuli significantly deflected from frame stimuli when no TMS was applied (significant interval = 227–313 msec, P < 0.05, corrected for multiple comparison with the FDR) or (C) when TMS was applied in an intermediate time window (significant interval = 230–348 msec, P < 0.05, corrected for multiple comparison with the FDR). (B) This significant deflection was no longer present when TMS was applied in an early time window. Signals behind the vertical bar represent interpolated data. ERPs are computed for a cluster of peri-occipital electrodes (O1, O2, Oz, POz, PO3, PO4, PO5, PO6, PO7, and PO8). TMS, transcranial magnetic stimulation; EEG, electroencephalography; FDR, false discovery rate; ERP, event-related potential.
Figure 7
Figure 7
Transcranial magnetic stimulation (TMS) modulation of stack–frame difference. (A) Early TMS reduced the difference in activity evoked by stack and activity evoked by frame stimuli in comparison with the no TMS condition (t = 2.97, P = 0.01, two-tailed) and the intermediate TMS condition (t = 2.50, P = 0.04, two-tailed). No difference was found between no TMS and TMS applied in the intermediate time window (t = 0.95, P = 0.37, two-tailed). (B) Excluding error trials resulted in an increased (trend) stack–frame difference (collapsed across TMS conditions, correct trials vs. all trials: t = 1.60, P = 0.07, one-tailed). The dashed lines display the increase in the stack–frame difference for each TMS condition after excluding error trials. The stack–frame difference for correct trials is only significant between the no TMS and early TMS conditions (t = 2.62, P = 0.03, two-tailed). Data are means ± SEM.

Similar articles

Cited by

References

    1. Albright TD, Stoner GR. Contextual influences on visual processing. Annu. Rev. Neurosci. 2002;25:339–379. - PubMed
    1. Angelucci A, Levitt JB, Walton EJS, Hupé JM, Bullier J, Lund JS. Circuits for local and global signal integration in primary visual cortex. J. Neurosci. 2002;22:8633–8646. - PMC - PubMed
    1. Appelbaum LG, Wade AR, Vildavski VY, Pettet MW, Norcia AM. Cue-invariant networks for figure and background processing in human visual cortex. J. Neurosci. 2006;26:11695–11708. - PMC - PubMed
    1. Bach M, Meigen T. Similar electrophysiological correlates of texture segregation induced by luminance, orientation, motion and stereo. Vision Res. 1997;37:1409–1414. - PubMed
    1. Benjamini Y, Hochberg Y. Controlling the false discovery rate: a practical and powerful approach to multiple testing. J. Roy. Stat. Soc. B (Methodol.) 1995;57:289–300.

LinkOut - more resources