. 2013 Feb;12(1):70-7.
doi: 10.1111/gbb.12004. Epub 2012 Dec 13.

Genotype modulates age-related alterations in sensitivity to the aversive effects of ethanol: an eight inbred strain analysis of conditioned taste aversion

Affiliations

Genotype modulates age-related alterations in sensitivity to the aversive effects of ethanol: an eight inbred strain analysis of conditioned taste aversion

E M Moore et al. Genes Brain Behav. 2013 Feb.

Abstract

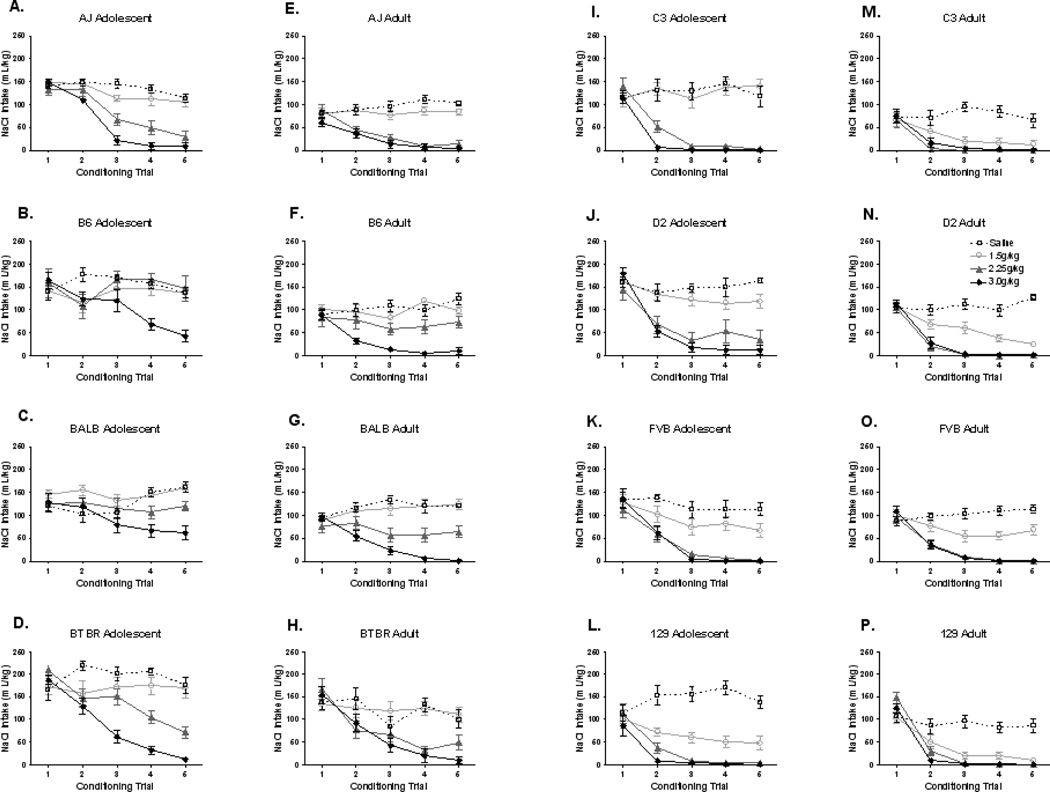
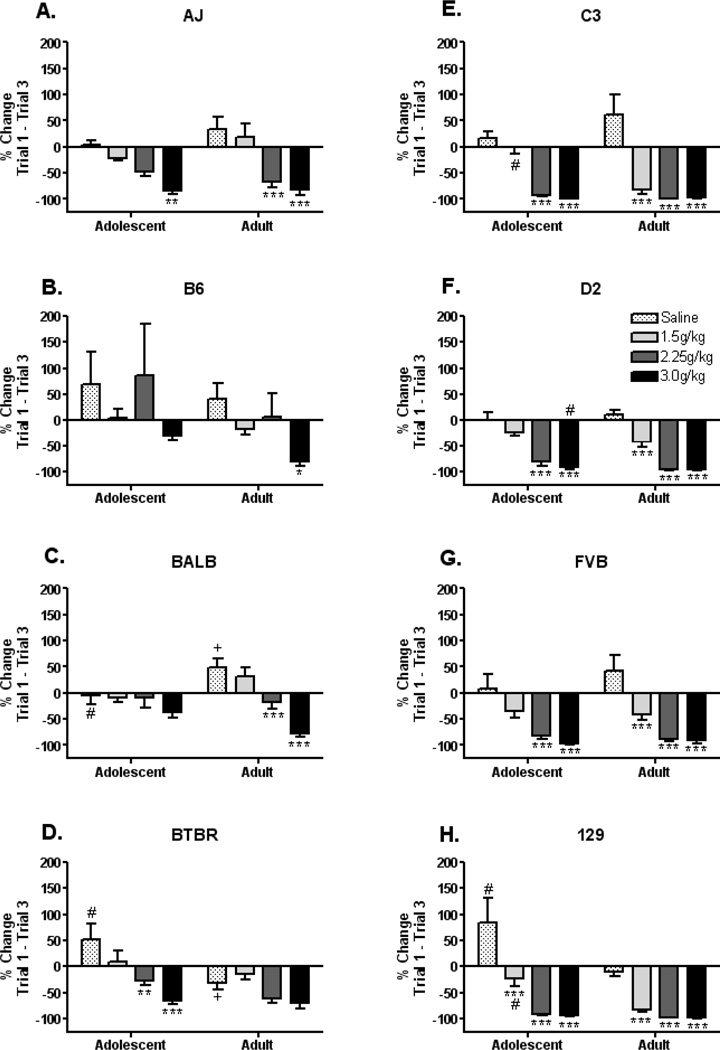
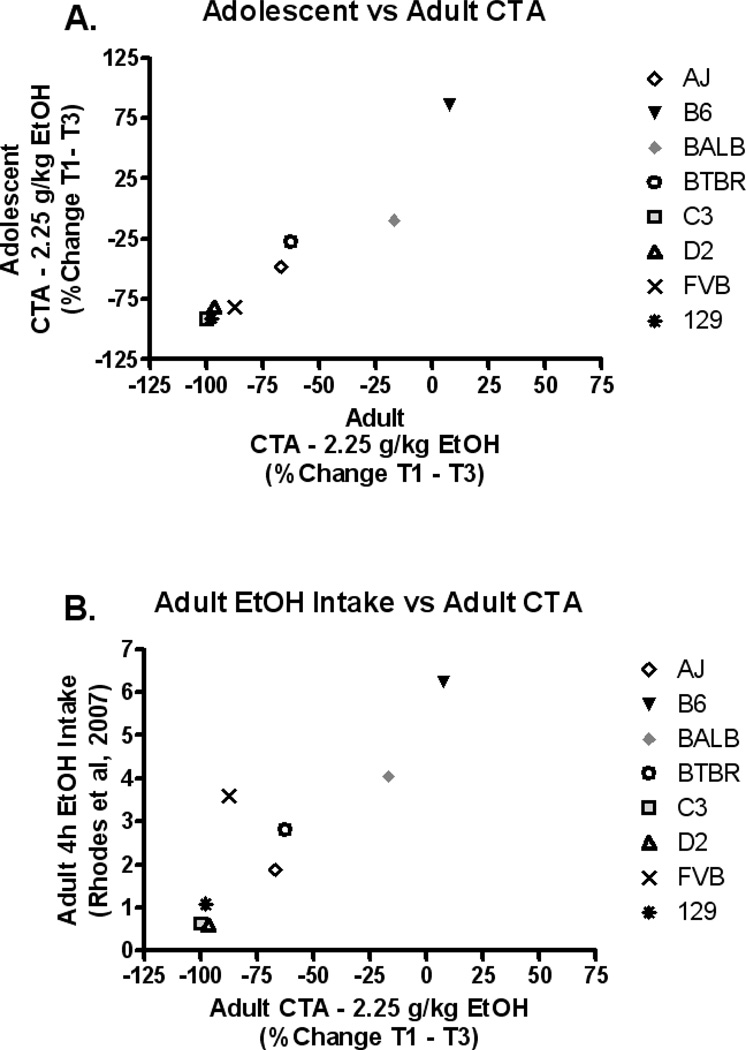
Adolescent individuals display altered behavioral sensitivity to ethanol, which may contribute to the increased ethanol consumption seen in this age-group. However, genetics also exert considerable influence on both ethanol intake and sensitivity. Currently there is little research assessing the combined influence of developmental and genetic alcohol sensitivities. Sensitivity to the aversive effects of ethanol using a conditioned taste aversion (CTA) procedure was measured during both adolescence (P30) and adulthood (P75) in eight inbred mouse strains (C57BL/6J, DBA/2J, 129S1/SvImJ, A/J, BALB/cByJ, BTBR T(+) tf/J, C3H/HeJ and FVB/NJ). Adolescent and adult mice were water deprived, and subsequently provided with access to 0.9% (v/v) NaCl solution for 1 h. Immediately following access mice were administered ethanol (0, 1.5, 2.25 and 3 g/kg, ip). This procedure was repeated in 72 h intervals for a total of five CTA trials. Sensitivity to the aversive effects of ethanol was highly dependent upon both strain and age. Within an inbred strain, adolescent animals were consistently less sensitive to the aversive effects of ethanol than their adult counterparts. However, the dose of ethanol required to produce an aversion response differed as a function of both age and strain.


Conflict of interest statement

The authors have no conflicts of interest to declare.

Figures

Figure 1
Figure 1. Adolescent and adult mL/kg NaCl solution consumed across conditioned taste aversion trials
(A) AJ adolescents, n’s: saline=8, 1.5g/kg=8, 2.25g/kg=6, 3.0g/kg=6. (B) B6 adolescents, n’s: saline=7, 1.5g/kg=7, 2.25g/kg=6, 3.0g/kg=7. (C) BALB adolescents, n’s: saline=6, 1.5g/kg=6, 2.25g/kg=6, 3.0g/kg=6. (D) BTBR adolescents, n’s: saline=9, 1.5g/kg=8, 2.25g/kg=7, 3.0g/kg=10. (E) AJ adults, n’s: saline=11, 1.5g/kg=10, 2.25g/kg=10, 3.0g/kg=11. (F) B6 adults, n’s: saline=10, 1.5g/kg=10, 2.25g/kg=7, 3.0g/kg=10. (G) BALB adults, n’s: saline=10, 1.5g/kg=11, 2.25g/kg=10, 3.0g/kg=10. (H) BTBR adults, n’s: saline=12, 1.5g/kg=12, 2.25g/kg=9, 3.0g/kg=10. (I) C3 adolescents, n’s: saline=6, 1.5g/kg=6, 2.25g/kg=7, 3.0g/kg=7. (J) D2 adolescents, n’s: saline=9, 1.5g/kg=10, 2.25g/kg=9, 3.0g/kg=9. (K) FVB adolescents, n’s: saline=10, 1.5g/kg=9, 2.25g/kg=9, 3.0g/kg=7. (L) 129 adolescents, n’s: saline=8, 1.5g/kg=9, 2.25g/kg=8, 3.0g/kg=8. (M) C3 adults, n’s: saline=9, 1.5g/kg=8, 2.25g/kg=8, 3.0g/kg=8. (N) D2 adults, n’s: saline=11, 1.5g/kg=12, 2.25g/kg=8, 3.0g/kg=12. (O) FVB adults, n’s: saline=9, 1.5g/kg=10, 2.25g/kg=10, 3.0g/kg=10. (P) 129 adults, n’s: saline=12, 1.5g/kg=14, 2.25g/kg=11, 3.0g/kg=11.
Figure 2
Figure 2. Ethanol induced conditioned taste aversion: percent change from trial 1 to trial 3
(A) AJ adolescents display a CTA response at 3.0g/kg ethanol, while adults display a CTA response at 2.25 and 3.0g/kg ethanol. (B) B6 adolescents do not display a CTA response at any of the doses tested, however B6 adults display a CTA response at 3.0g/kg ethanol. (C) BALB adolescents do not display a CTA response at any of the doses tested, however BALB adults display a CTA response at 2.25 and 3.0g/kg ethanol. (D) BTBR adolescents display a CTA response at 2.25 and 3.0 g/kg ethanol, but BTBR adults do not display a significant CTA response at any of the doses tested, likely because they reduce NaCl intake following saline injections. (E) C3 adolescents display a CTA response at 2.25 and 3.0 g/kg ethanol, while C3 adults display a CTA response at all ethanol doses (1.5, 2.25 and 3.0 g/kg). (F) D2 adolescents display a CTA response at 2.25 and 3.0g/kg ethanol, while D2 adults display a CTA response at all ethanol doses (1.5, 2.25, 3.0 g/kg). (G) FVB adolescents display a CTA response at 2.25 and 3.0g/kg ethanol, while FVB adults display a CTA response at all ethanol doses (1.5, 2.25, 3.0 g/kg). (H) 129 adolescents and adults display a CTA response at all ethanol doses, however the adolescents do not display as large of a reduction at the 1.5g/kg ethanol dose as do the adults. (*=p<0.05, **=p<0.01, ***=p<0.001; the asterisks (*) indicates significant difference from saline control within age-group; # indicates significant age difference at the same dose; + indicates a significant change from zero in the saline treated group).
Figure 3
Figure 3. Phenotypic correlations
(A) Adolescent and adult strain mean CTA responses are significantly correlated (percent change Trial 1–3, 2.25g/kg ethanol dose; r=0.96, p<0.001), suggesting that the same or very similar genes likely contribute to the behavior at both ages. (B) Adult strain mean CTA responses (percent change Trial 1–3, 2.25g/kg ethanol dose) is significantly negatively associated with adult limited access ethanol intakes reported by Rhodes et al, 2007 (4h male strain means; r= −0.82, p<0.05).

References

    1. Anderson RI, Varlinskaya EI, Spear LP. Ethanol-induced conditioned taste aversion in male Sprague dawley rats: impact of age and stress. Alcohol Clin Exp Res. 2010;34(12):2106–2115. - PMC - PubMed
    1. Badia-Elder NE, Stewart RB, Powrozek TA, Woods JE, II, Murphy JM, Lumeng L, Li T-K. Ethanol- induced conditioned taste aversion in high alcohol drinking (HAD) and low alcohol drinking (LAD) rats. Alcohol Clin Exp Res. 1999;23:104A. (Abstract). - PubMed
    1. Broadbent J, Muccino KJ, Cunningham CL. Ethanol-induced conditioned taste aversion in 15 inbred mouse strains. Behav Neurosci. 2002;116:138–148. - PubMed
    1. Brunetti G, Carai MAM, Lobina C, Melis S, Serra S, Vacca G, et al. Differences in ethanol-induced conditioned taste aversion in Sardinian alcohol-preferring and Sardinian alcohol-nonpreferring rats. Alcohol. 2002;26(3):167–172. - PubMed
    1. Chester JA, Blose AM, Froehlich JC. Further evidence of an inverse-genetic relationship between innate differences in alcohol preference and alcohol withdrawal magnitude in multiple selectively bred rat lines. Alcohol Clin Exp Res. 2003;27(3):377–387. - PubMed

Publication types