. 2012 Nov 21:9:279.
doi: 10.1186/1743-422X-9-279.

The development and application of new crystallization method for tobacco mosaic virus coat protein

Affiliations

The development and application of new crystallization method for tobacco mosaic virus coat protein

Xiangyang Li et al. Virol J. .

Abstract

Background: Although tobacco mosaic virus (TMV) coat protein (CP) has been isolated from virus particles and its crystals have grown in ammonium sulfate buffers for many years, to date, no one has reported on the crystallization of recombinant TMV-CP connecting peptides expressed in E. coli.

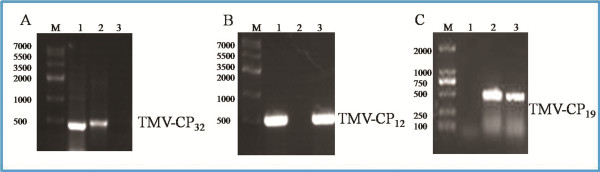
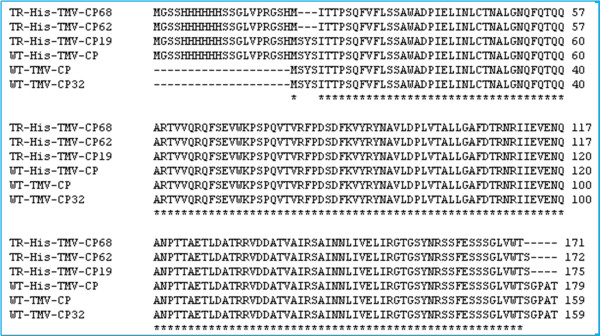
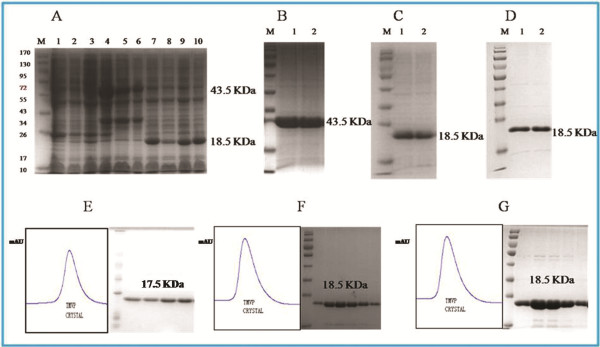
Methods: In the present papers genetically engineered TMV-CP was expressed, into which hexahistidine (His) tags or glutathione-S-transferase (GST) tags were incorporated. Considering that GST-tags are long peptides and His-tags are short peptides, an attempt was made to grow crystals of TMV-CP cleaved GST-tags (WT-TMV-CP32) and TMV-CP incorporated His-tags (WT-His-TMV-CP12) simultaneously in ammonium sulfate buffers and commercial crystallization reagents. It was found that the 20S disk form of WT-TMV-CP32 and WT-His-TMV-CP12 did not form high resolution crystals by using various crystallization buffers and commercial crystallization reagents. Subsequently, a new experimental method was adopted in which a range of truncated TMV-CP was constructed by removing several amino acids from the N- or the C-terminal, and high resolution crystals were grown in ammonium sulfate buffers and commercial crystallization reagents.

Results: The new crystallization method was developed and 3.0 Å resolution macromolecular crystal was thereby obtained by removing four amino acids at the C-terminal of His-TMV-CP and connecting six His-tags at the N-terminal of His-TMV-CP (TR-His-TMV-CP19). The Four-layer aggregate disk structure of TR-His-TMV-CP19 was solved. This phenomenon showed that peptides at the C-terminus hindered the growth of high resolution crystals and the peptides interactions at the N-terminus were attributed to the quality of TMV-CP crystals.

Conclusion: A 3.0 Å resolution macromolecular crystal of TR-His-TMV-CP19 was obtained and the corresponding structure was solved by removing four amino acids at the C-terminus of TMV-CP and connecting His-tags at the N-terminus of TMV-CP. It indicated that short peptides influenced the resolution of TMV-CP crystals.


Figures

Figure 1
Figure 1
TMV-CP DNA fragments (1% agarose gel). (A) The whole TMV-CP fragments with BamH I and Xho I restriction enzyme cutting sites which have been cloned in PGEX-6P-1. As shown in lane 1, amplified PCR product ran at approximately 500 bp compared with the DNA marker (lane M). Lane 2 is a positive control with DNA template. Lane 3 is a negative control without DNA template. (B) The whole TMV-CP fragments with Nde I and Xho I restriction enzyme cutting sites that have been cloned in pET28a. As shown in lane 1, amplified PCR product ran at approximately 500 bp compared with the DNA marker (lane M). Lane 2 is a negative control without DNA template. Lane 3 is a positive control with DNA template. (C) The truncation of four amino acids from the C-terminus of TMV-CP fragments with Nde I and Xho I restriction enzyme cutting sites that have been cloned in pET28a. Lane 1 is a negative control without DNA template, whereas lane 2 is a positive control with DNA template. Lane 3 is the amplified PCR product that ran at approximately 500 bp compared with the DNA marker (lane M).
Figure 2
Figure 2
Alignment of the TMV-CP Sequences, the identical residues were marked below by an asterisk.
Figure 3
Figure 3
The generation of expression and purification of target protein that was analyzed using 12% SDS-PAGE. (A) Protein molecular weight standards are shown in lane 1. Numbers on the left are the MW of the standards in kDa. Lanes 1, 2, and 3 show the controls without induction by IPTG that were 20 μL aliquots of whole cell lysates from 10 mL PGEX-6P-1-WT-GST-TMV-CP32-BL21(DE3)-RIL, pET28a-His-TMV-CP12-BL21(DE3)-RIL, and pET28a-TR-His-TMV-CP19-BL21(DE3)-RIL cultures, respectively. Lanes 4, 5, and 6 correspond to the cultures after expression that were from 20 μL aliquots of whole cell lysates from 1 L PGEX-6P-1-WT-GST-TMV-CP32-BL21(DE3)-RIL cultures with IPTG. A new protein band at 43.5 kDa corresponds to the target protein GST-TMV-CP. Lanes 7 and 8 correspond to the cultures after expression that were from 20 μL aliquots of whole cell lysates from 1 L pET28a-TR-His-TMV-CP12-BL21(DE3)-RIL and pET28a-TR-His-TMV-CP68-BL21(DE3)-RIL culture with IPTG, respectively. A new protein band at position 18.5 kDa corresponds to the target protein. Lanes 9 and 10 correspond to the cultures after expression that were from 20 μL aliquots of whole cell lysates from 1 L pET28a-TR-His-TMV-CP62-BL21(DE3)-RIL and pET28a-TR-His-TMV-CP19-BL21(DE3)-RIL cultures with IPTG, respectively. A new protein band at position 18.5 kDa corresponds to the target protein. (B) WT-GST-TMV-CP32 protein is shown in lanes 1 and 2 purified using nickel-nitrilotriacetic acid (Ni-NTA) column. (C) WT-His-TMV-CP12 protein is shown in Lanes 1 and 2 purified using Ni-NTA column. (D) TR-His-TMV-CP19 protein is shown in Lanes 1 and 2 purified using Ni-NTA column. (E) WT-TMV-CP32 protein cleaved GST-tags is shown in 12% SDS-PAGE gel filtration purified using HiLoad 16/60 Superdex 200 pg column. (F) WT-His-MV-CP12 protein is shown in 12% SDS-PAGE gel filtration purified using HiLoad 16/60 Superdex 200 pg column. (G) TR-His-MV-CP19 protein is shown in 12% SDS-PAGE gel filtration purified using HiLoad 16/60 Superdex 200 pg column.
Figure 4
Figure 4
Crystallization of WT-TMV-CP32 (Cleaved GST-tags) and WT-His-TMV-CP12, the scale bar represents 0.1 mm. (A) and (E) Typical octahedral WT-His-TMV-CP12 crystals grown in the crystallization room at 295 K. The crystals did not grow bigger regardless of the time of exposure in the crystallization reagent. (B), (C), and (D) Screening and optimization of WT-His-TMV-CP12 crystallization. Although the size of the crystals improved, the quality of the crystals did not. Conversely, most of the improved crystals have no diffraction. (F), (G), and (H) Optimization of crystallization reagents facilitated growth of WT-His-TMV-CP12 crystals. Results showed that increased salt and ionic strength increased by the crystallization reagent changed the crystallization from octahedral crystals to bar and lamellar crystals. (I) WT-TMV-CP32 microcrystal that was cloned using the vector of PGEX-6P-1, purified using His-tags, cleaved GST-tags by PreScission Protease. In addition, seeding tools were used and crystallization reagents were changed, including the crystallization reagents of Hampton research, in an attempt to improve the quality and size of the crystals or to produce a different crystal form. Only twin crystals or polycrystalline were obtained, as shown in (J), (K), and (L).
Figure 5
Figure 5
Examples of TR-His-TMV-CP19 crystals with fused short peptides and truncated four amino acids from the C-terminus (Showed in Table4), the scale bar represents 0.1 mm.
Figure 6
Figure 6
The form of TR-His-TMV-CP19 proteins were analyzed by SEC and 17% Native-PAGE and the diffraction analysis of crystals on proteins of TR-His-TMV-CP19 and WT-His-TMV-CP12 (A) The assembly of TR-His-TMV-CP19 was measured by Superdex 200 10/300 GL Column, Blue line represented TR-His-TMV-CP19 dialyzed against 0.2 mol/L ammonium sulfate and 0.1 mol/L Tris solution ( PH 8.0 ) at room temperature for 12 hr. Protein peaks were monitored by UV absorbance at wavelength of 280 nm and retention volumes corresponding to molecular mass were recorded in 20 mM PB and 100 mM sodium chloride, the molecular mass standards were indicated on top of the figure;Red line represents TMV-CP control which did not dialyze against, (B) the 17% Native-PAGE of WT-His-TMV-CP19. As shown in lane M. Numbers on the left were the MW of the standards in kDa, Lanes 1, 2, correspond to the WT-His-TMV-CP19 dialyzed against 0.2 mol/L ammonium sulfate and 0.1 mol/L Tris solution ( PH 8.0 ) at room temperature for 12 hr, (C) the 17% Native-PAGE of WT-His-TMV-CP19. As shown in lane M. Numbers on the left were the MW of the standards in kDa, Lanes 1, 2, correspond to the WT-His-TMV-CP19 did not dialyze against the corresponding solution, (D) X-ray crystal diffraction of WT-His-TMV-CP12 marked in Figure 5B, (E) X-ray crystal diffraction of TR-His-TMV-CP19 marked in Figure 6A, (F) X-ray crystal diffraction of TR-His-TMV-CP19 marked in Figure 6G, (G) X-ray crystal diffraction of TR-His-TMV-CP19 marked in Figure 6J, (H) X-ray crystal diffraction of TR-His-TMV-CP19 obtained from the conditions of Figure 6J, (I) The Four-layer aggregate structure of TR-His-TMV-CP19 incorporated His-tags.
Figure 7
Figure 7
Diagram showing the growth curve of the crystallization of TR-His-TMV-CP19. The predominant species at protein concentration conditions of 8.0–14 mg/mL at pH 6.8–7.8 with ionic strength of 0.4–1.0 are the perfect crystals, identified as higher resolution crystals. As the pH falls below pH 7.0, TR-His-TMV-CP19 did not grow in the form of crystals. On the contrary, the TR-His-TMV-CP19 crystals grew with increasing protein concentration, pH (pH 7.8–8.0), and ionic strength (0.7–1.0) of the crystallization pool buffers. The crystals can also be harvested when the protein concentration is 14 mg/mL because high resolution crystals are formed at this concentration. When the crystallization pool buffers conditions are at pH 8.5 with ionic strength of 0.7–1.0, no high resolution crystals can be harvested.

Similar articles

Cited by

References

    1. Caspar DLD. Assembly and stability of the tobacco mosaic virus particle. Adv Protein Chem. 1963;18:37–121. - PubMed
    1. Bloomer AC, Champness JN, Bricogne G, Stoden R, Klug A. Protein disk of tobacco mosaic virus at 2.8 Å resolution showing the interaction within and between subunits. Nature. 1978;276:362–368. doi: 10.1038/276362a0. - DOI - PubMed
    1. Culver JN. Tobacco mosaic virus assembly and disassembly: Determinants in pathogenicity and resistance. Annu Rev Phytopathol. 2002;40:287–308. doi: 10.1146/annurev.phyto.40.120301.102400. - DOI - PubMed
    1. Harrison BD, Wilson TM. Milestones in the research on tobacco mosaic virus. Philos Trans R Soc B. 1999;354:521–529. doi: 10.1098/rstb.1999.0403. - DOI - PMC - PubMed
    1. Scheele RB, Schuster TM. Kinetics of protein subunit interaction: simulation of a polymerized overshoot. Biopolymers. 1974;13:275–288. doi: 10.1002/bip.1974.360130204. - DOI - PubMed

Publication types

MeSH terms

Substances