. 2013 Jan;41(Database issue):D676-83.
doi: 10.1093/nar/gks1064. Epub 2012 Nov 20.

DictyBase 2013: integrating multiple Dictyostelid species

Affiliations

DictyBase 2013: integrating multiple Dictyostelid species

Siddhartha Basu et al. Nucleic Acids Res. 2013 Jan.

Abstract

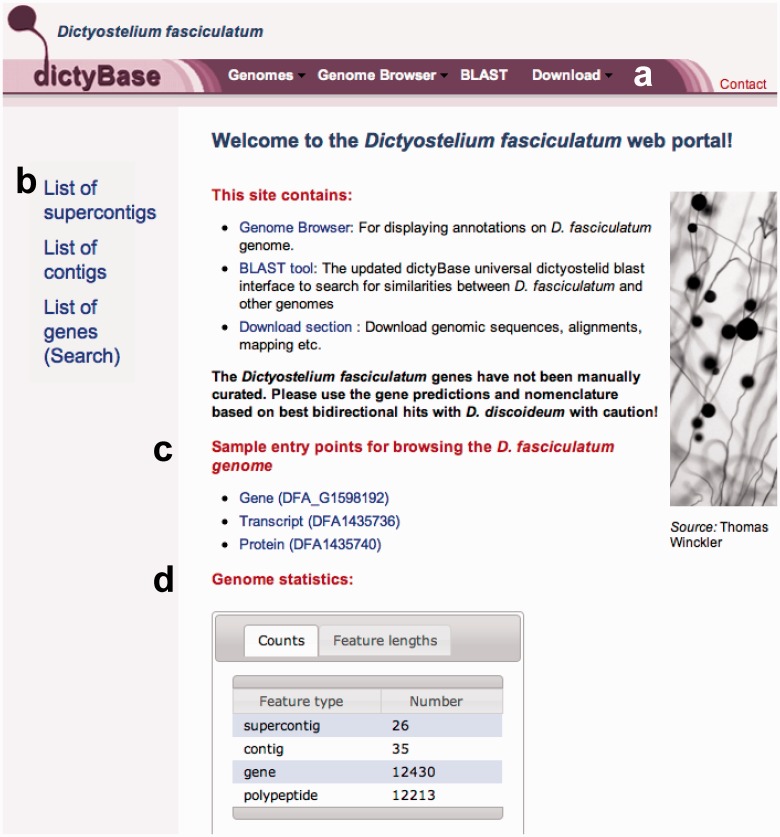
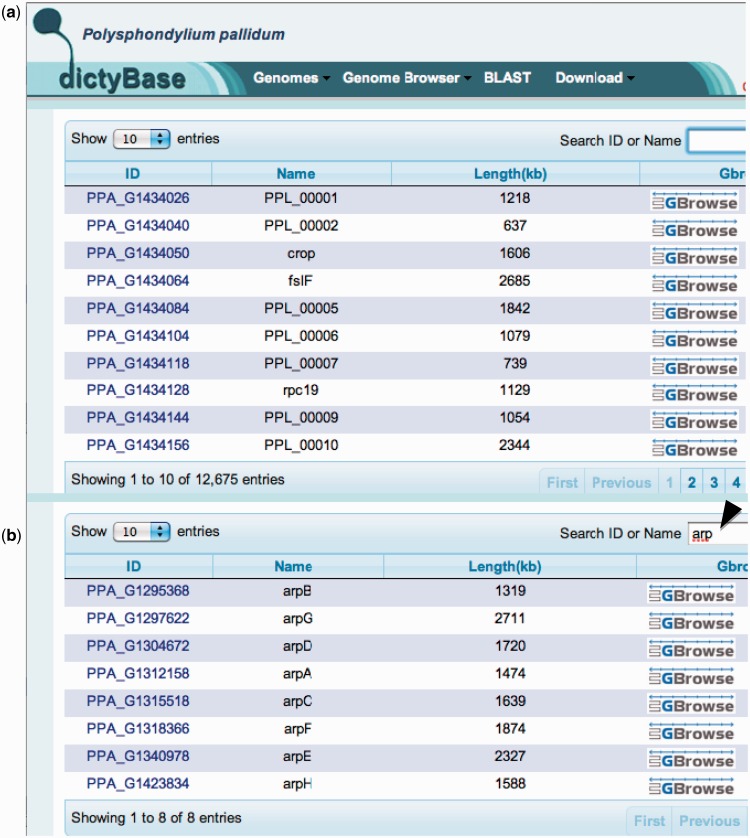
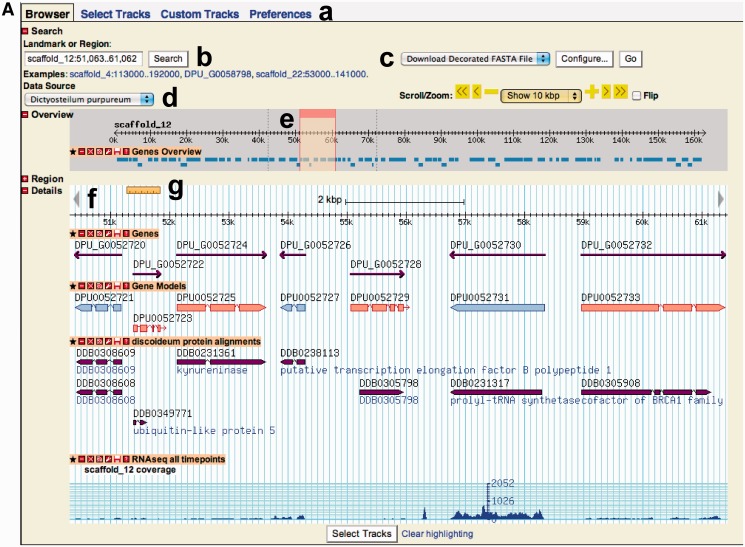
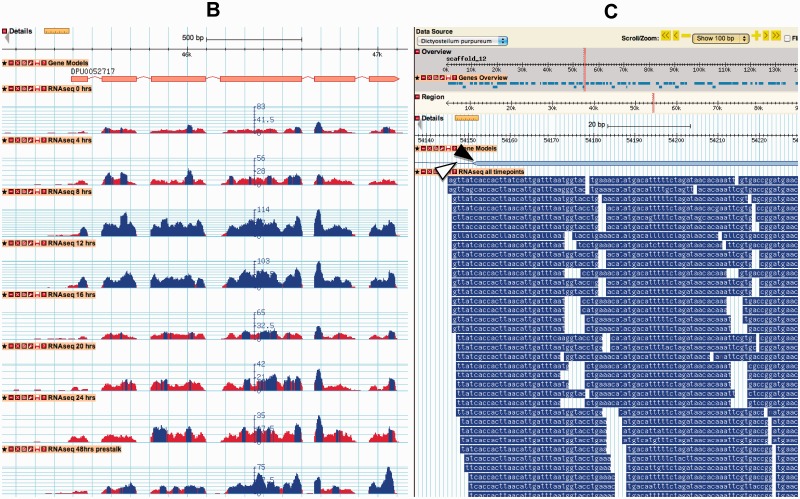
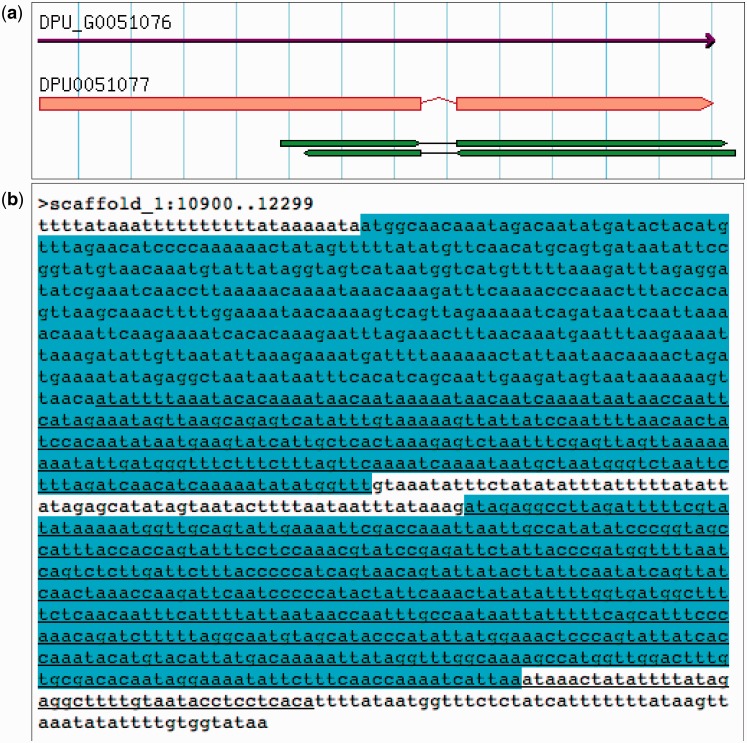
dictyBase (http://dictybase.org) is the model organism database for the social amoeba Dictyostelium discoideum. This contribution provides an update on dictyBase that has been previously presented. During the past 3 years, dictyBase has taken significant strides toward becoming a genome portal for the whole Amoebozoa clade. In its latest release, dictyBase has scaled up to host multiple Dictyostelids, including Dictyostelium purpureum [Sucgang, Kuo, Tian, Salerno, Parikh, Feasley, Dalin, Tu, Huang, Barry et al.(2011) (Comparative genomics of the social amoebae Dictyostelium discoideum and Dictyostelium purpureum. Genome Biol., 12, R20)], Dictyostelium fasciculatum and Polysphondylium pallidum [Heidel, Lawal, Felder, Schilde, Helps, Tunggal, Rivero, John, Schleicher, Eichinger et al. (2011) (Phylogeny-wide analysis of social amoeba genomes highlights ancient origins for complex intercellular communication. Genome Res., 21, 1882-1891)]. The new release includes a new Genome Browser with RNAseq expression, interspecies Basic Local Alignment Search Tool alignments and a unified Basic Local Alignment Search Tool search for cross-species comparisons.


Figures

Figure 1.
Figure 1.
The front page of D. fasciculatum. (a) The top bar contains four drop-down menus (Genomes, Genome Browser, BLAST and Download) that provide a selection for all genomes (including D. discoideum), allowing the user to easily switch between genomes or access functions available for the currently displayed genome. (b) Quick links to lists of sequences are available on the left-hand side of the page. (c) The page also provides sample entry points for a gene, a transcript and a protein to help first time or occasional users. (d) Genome statistics display available statistics for the current genome. Note that features vary slightly for each genome depending on the available data.
Figure 2.
Figure 2.
Table of genes with quick gene search for P. pallidum. (a) The table displays 10, 25, 50 or 100 entries at a time selectable by drop-down. The table includes the length of the gene and a link to that gene in the Genome Browser. (b) To search for a gene, start typing any gene name or gene ID and the list will be restricted instantly to those genes with that name or ID. (b) The search for ‘arp’ (arrow head) retrieves eight entries that contain those letters in their name.
Figure 3.
Figure 3.
The Genome Browser. (A) A graphical display of 10 kb of the D. purpureum genome. (a) Tabs at the top, Select Tracks, Custom Tracks and Preferences, allow choosing specific genome features, add new ones and customize display preferences. (b) The search box allows to search for any gene name or ID using an auto-complete function, or to enter distinct coordinates. (c) The download menu contains options to display the DNA sequence or as a decorated Fasta file, the position of restriction sites or track data in GFF format. (d) The Data Source drop-down lets the visitor easily switch between genomes. (e) Overview section: this area shows a compressed view of the contig or chromosome. Moving the red box from side to side allows changing the Region Details area without reloading the page. (f) The Region Details area displays the individual chromosomal features in selectable tracks. Tracks shown from top to bottom are as follows: D. purpureum Genes, Gene Models, D. discoideum protein alignments and RNAseq (all time points). (g) A small ruler may be clicked and expanded to assess the exact alignment of sequences. (B) This is an expansion of the Region Details section, showing selected RNAseq data available for the sequence DPU0052717. The top track displays the gene model, all tracks below display RNAseq levels at different developmental time points: 0, 4, 8, 12, 16, 20, 24 and at 48 h after slug migration, pre-stalk cells only. The RNAseq data shows that this gene (the D. purpureum ortholog of the D. discoideum KsrA kinase) is up-regulated at 12 and 16 h, the stage when stalk formation begins. Pre-stalk expression is also confirmed in the 48-h prestalk track at the bottom. The blue color indicates expression above threshold, red indicates low expression below threshold. Also, keep in mind that the scale of the y-axis must be considered when assessing expression levels—GBrowse autoscales each track. (C) When the ‘RNAseq all time points’ are selected and zoomed in to <100 bp, all individual reads of the RNAseq data can be viewed. In this D. purpureum example, 100 bp at an intron/exon boundary are shown, and the RNAseq data indicate that the exon start from the automatic gene prediction (black arrow head) should be moved a few nucleotides upstream to the agT splice acceptor as indicated by the top RNAseq tracks (white arrow head).
Figure 3.
Figure 3.
The Genome Browser. (A) A graphical display of 10 kb of the D. purpureum genome. (a) Tabs at the top, Select Tracks, Custom Tracks and Preferences, allow choosing specific genome features, add new ones and customize display preferences. (b) The search box allows to search for any gene name or ID using an auto-complete function, or to enter distinct coordinates. (c) The download menu contains options to display the DNA sequence or as a decorated Fasta file, the position of restriction sites or track data in GFF format. (d) The Data Source drop-down lets the visitor easily switch between genomes. (e) Overview section: this area shows a compressed view of the contig or chromosome. Moving the red box from side to side allows changing the Region Details area without reloading the page. (f) The Region Details area displays the individual chromosomal features in selectable tracks. Tracks shown from top to bottom are as follows: D. purpureum Genes, Gene Models, D. discoideum protein alignments and RNAseq (all time points). (g) A small ruler may be clicked and expanded to assess the exact alignment of sequences. (B) This is an expansion of the Region Details section, showing selected RNAseq data available for the sequence DPU0052717. The top track displays the gene model, all tracks below display RNAseq levels at different developmental time points: 0, 4, 8, 12, 16, 20, 24 and at 48 h after slug migration, pre-stalk cells only. The RNAseq data shows that this gene (the D. purpureum ortholog of the D. discoideum KsrA kinase) is up-regulated at 12 and 16 h, the stage when stalk formation begins. Pre-stalk expression is also confirmed in the 48-h prestalk track at the bottom. The blue color indicates expression above threshold, red indicates low expression below threshold. Also, keep in mind that the scale of the y-axis must be considered when assessing expression levels—GBrowse autoscales each track. (C) When the ‘RNAseq all time points’ are selected and zoomed in to <100 bp, all individual reads of the RNAseq data can be viewed. In this D. purpureum example, 100 bp at an intron/exon boundary are shown, and the RNAseq data indicate that the exon start from the automatic gene prediction (black arrow head) should be moved a few nucleotides upstream to the agT splice acceptor as indicated by the top RNAseq tracks (white arrow head).
Figure 4.
Figure 4.
The decorated Fasta file. This decorated Fasta file is available at the ‘download’ drop-down (see Figure 3A). (a) Gene Model of gene DPU_G0051076. On top, gene track and below, gene prediction; the last track represents BLAST-aligned ESTs. (b) Decoration needs to be configured. In this example, the exons are highlighted and the ESTs are indicated by the underline. Note that the EST alignment supports the gene model exon/intron structure.

Similar articles

Cited by

References

    1. Eichinger L, Pachebat JA, Glöckner G, Rajandream M, Sucgang R, Berriman M, Song J, Olsen R, Szafranski K, Xu Q, et al. The genome of the social amoeba Dictyostelium discoideum. Nature. 2005;435:43–57. - PMC - PubMed
    1. Schaap P, Winckler T, Nelson M, Alvarez-Curto E, Elgie B, Hagiwara H, Cavender J, Milano-Curto A, Rozen DE, Dingermann T, et al. Molecular phylogeny and evolution of morphology in the social amoebas. Science. 2006;314:661–663. - PMC - PubMed
    1. Chisholm RL, Gaudet P, Just EM, Pilcher KE, Fey P, Merchant SN, Kibbe WA. dictyBase, the model organism database for Dictyostelium discoideum. Nucleic Acids Res. 2006;34:D423–D427. - PMC - PubMed
    1. Ogawa S, Yoshino R, Angata K, Iwamoto M, Pi M, Kuroe K, Matsuo K, Morio T, Urushihara H, Yanagisawa K, et al. The mitochondrial DNA of Dictyostelium discoideum: complete sequence, gene content and genome organization. Mol. Gen. Genet. 2000;263:514–519. - PubMed
    1. Sucgang R, Chen G, Liu W, Lindsay R, Lu J, Muzny D, Shaulsky G, Loomis W, Gibbs R, Kuspa A. Sequence and structure of the extrachromosomal palindrome encoding the ribosomal RNA genes in Dictyostelium. Nucleic Acids Res. 2003;31:2361–2368. - PMC - PubMed

Publication types