. 2013 Jan;41(2):1124-34.
doi: 10.1093/nar/gks1045. Epub 2012 Nov 20.

Activity-regulated RNA editing in select neuronal subfields in hippocampus

Affiliations

Activity-regulated RNA editing in select neuronal subfields in hippocampus

Ales Balik et al. Nucleic Acids Res. 2013 Jan.

Abstract

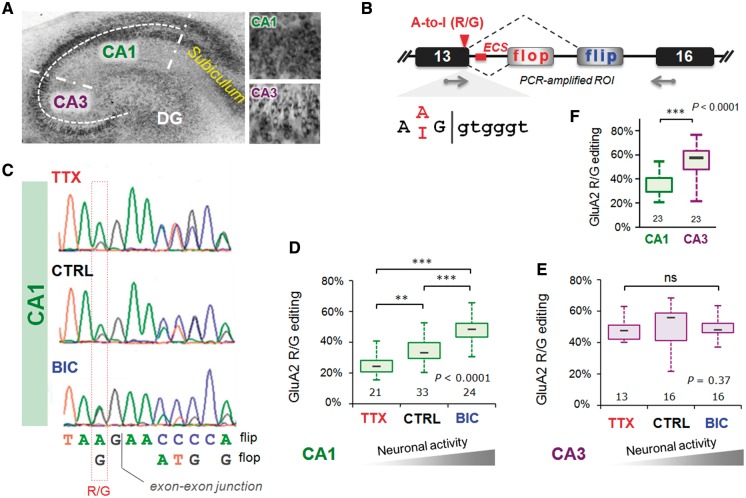
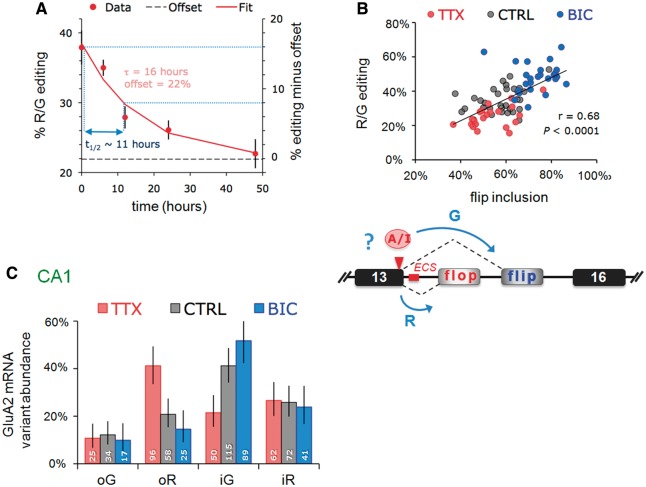
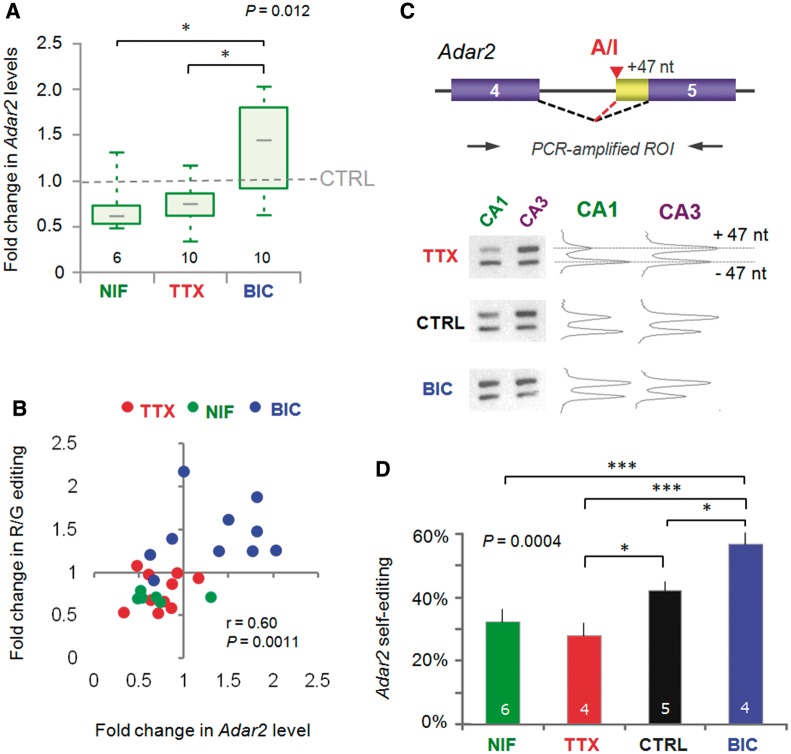
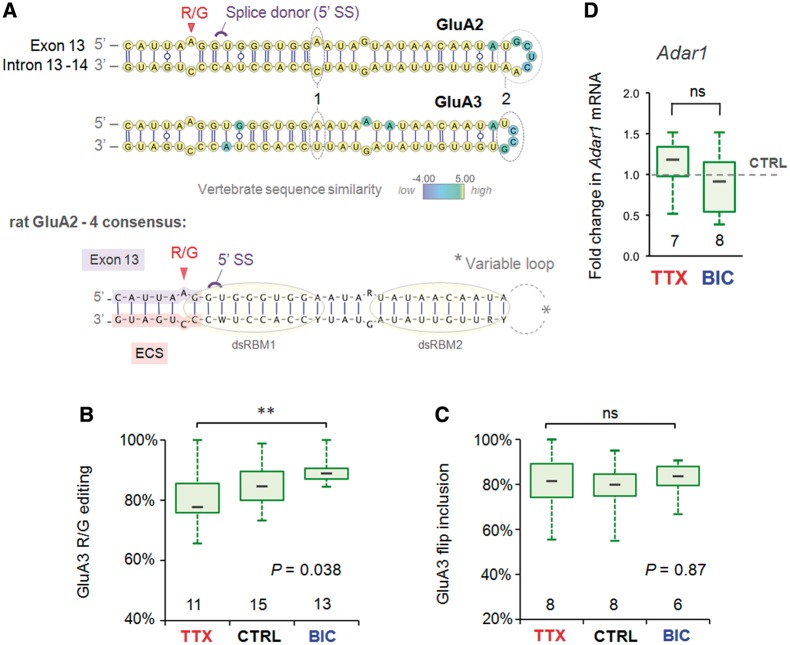
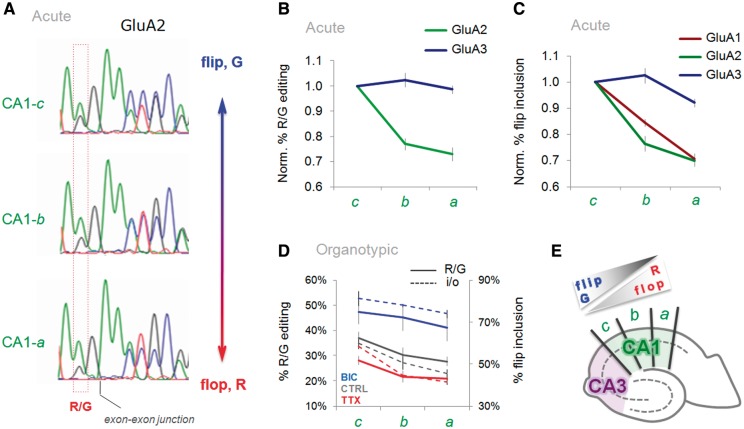
RNA editing by adensosine deaminases is a widespread mechanism to alter genetic information in metazoa. In addition to modifications in non-coding regions, editing contributes to diversification of protein function, in analogy to alternative splicing. However, although splicing programs respond to external signals, facilitating fine tuning and homeostasis of cellular functions, a similar regulation has not been described for RNA editing. Here, we show that the AMPA receptor R/G editing site is dynamically regulated in the hippocampus in response to activity. These changes are bi-directional, reversible and correlate with levels of the editase Adar2. This regulation is observed in the CA1 hippocampal subfield but not in CA3 and is thus subfield/celltype-specific. Moreover, alternative splicing of the flip/flop cassette downstream of the R/G site is closely linked to the editing state, which is regulated by Ca(2+). Our data show that A-to-I RNA editing has the capacity to tune protein function in response to external stimuli.


Figures

Figure 1.
Figure 1.
Activity-dependent changes in GluA2 R/G editing localized to hippocampal CA1. (A) Nissl stain of an organotypic culture of a transverse hippocampal slice cultured for 3 weeks. The major subfields of the trisynaptic circuit are annotated: CA1, CA3 and the dentate gyrus. Right top and bottom show close-up images of CA1 and CA3 cells respectively. (B) Schematic illustrating the Gria2 locus encompassing exons 13–16; the region of interest (ROI), encodes segment 2 of the ligand-binding domain, the alternatively spliced i/o exons and the A/I RNA editing site, where arginine (R) is recoded to a glycine (G). The editing complementary sequence (ECS) forms a highly conserved pre-mRNA secondary structure encompassing the splice site (see Figure 4A). (C) Sequence traces show part of the ROI including the A/I editing site and the exon–exon junction between exon 13 and the flip/flop exon. Changes in GluA2 editing and splicing from mRNA extracted from CA1 tissue after 48 h TTX or BIC treatments. CTRL treatment represents mock feeding without drugs. (D) Quantification of the peak heights in CA1 sequence chromatograms is summarized in box and whisker plots. The plot shows levels of GluA2 R/G editing as a fraction of total subunit mRNA for the different drug treatments. The median is represented by a gray line. The box and whiskers show the interquartile range (25–75%) and the total range (min–max) of the data, respectively. The number at the base of each plot is the number of slices. The P-value is derived from the Kruskal–Wallis test statistic and the asterisks summarize the results of Dunn’s post-tests: **P < 0.01, ***P < 0.001. (E) As in Figure 1D but for mRNA extracted from micro-dissected CA3 tissue after 48 h treatments with TTX or BIC. Editing and splicing of GluA2 are invariant across drug treatments. (F) Box and whisker plots summarizing GluA2 R/G editing levels between subfields (CA1 and CA3) determined from peak height ratios. The P-value is derived from the Mann–Whitney U-statistic, ***P < 0.0001.
Figure 2.
Figure 2.
Changes in the expression of a subset of GluA2 mRNA variants underlie correlated editing and splicing. (A) Time course of GluA2 R/G editing changes in response to TTX. Slices were harvested 0, 6, 12, 24 and 48 h post-TTX. The sample size was eight to nine slices/time point. The amount of edited mRNA as a percentage of total GluA2 was determined from peak measurements of sequence traces. Data points were fit with a single exponential (y = Ae–τ/t + c). A half-life (t½) of 16 h was determined from the time constant (τ) using the equation: t½ = τ. –ln(0.5). (B) Top: the editing and flip/flop splicing determined from sequence chromatograms are plotted for each slice. Data points for each treatment are represented by different colors: red = TTX; black = CTRL; blue = BIC. The correlation coefficient (r) and P-values are determined by Spearman’s rank test on the entire data set. Bottom: schematic illustrating the Gria2 locus and a potential interaction between A-to-I editing and pre-mRNA splicing (blue arrows). (C) PCR products were ligated into a bacterial expression vector, transformed into E. coli and editing/splice-variant status of individual clones was identified by DNA sequencing. The bar graphs show the proportions determined from the weighted-mean of clone counts from 7, 8 and 7 slices for TTX, CTRL and BIC treatments, respectively. Total number of clones were 270, 335 and 256 for TTX, CTRL and BIC treatments, respectively. Error bars represent 95% CI for proportions. Data for each treatment are represented by different colors: red = TTX; gray = CTRL; blue = BIC. The number at the base of each column represents the number of clones.
Figure 3.
Figure 3.
RNA editing at the R/G site is correlated with altered mRNA levels and self-editing of the deaminase Adar2. (A) The fold change in CA1 mRNA levels of Adar2 for (48 h) drug treatments compared with the mean of CTRL samples from the same PCR runs. Adar2 expression was measured by real-time PCR using Taqman chemistry (FAM) and normalized to the endogenous house-keeping gene Gapdh (VIC). The graph summarizes data from four real-time PCR runs. The ΔΔCT method was used for analysis. By validation, standard curves run for primer-probe sets gave primer efficiencies >90%. Almost identical results were obtained using the β-2-microglobulin as a house keeping gene. The P-values are derived from the Kruskall–Wallis ANOVA test statistic and the asterices summarize the results of Dunn’s post-tests: *P < 0.05. (B) Changes in GluA2 R/G editing are positively correlated with changes in Adar2 expression. The fold change in GluA2 R/G editing is plotted against the fold change in mRNA levels of Adar2 for the same CA1 samples after 48 h drug treatments. Both editing and Gapdh-normalized Adar2 expression are compared with the mean of CTRL samples from the same PCR runs. Data points for each treatment are represented by different colors: red = TTX; blue = BIC; green = NIF. The correlation coefficient (r) and P-values are determined by Spearman’s rank test on the entire data set. (C) Neuronal activity triggers Adar2 auto-regulation by self-editing. Adar2 edits its own pre-mRNA in intron 2 to generate a new 3′ splice site to extend the second coding exon by 47 nt (top). The resulting frameshift leads to premature stop codon and a non-functional truncated protein. Thereby, Adar2 self-editing represents auto-regulation of its own expression by negative feedback. This is assayed by PCR amplification of the ROI (top) and separation of the fragments by gel electrophoresis (bottom left). Gel images were quantified using ImageJ software (NIH) (bottom right). (D) Plot summarizing the results of the quantification for +47 nt inclusion and thus self-editing for the different treatments. After 48 h activity deprivation with TTX and NIF, self-editing is lower, whereas increased activity has the opposite effect. The P-value is derived from the ANOVA test statistic and the asterices summarize the results of Student–Newman–Keuls post-tests: *P < 0.05, ***P < 0.001.
Figure 4.
Figure 4.
Comparison of activity-dependent R/G site regulation and substrate properties between AMPA subunit paralogs. (A) Top: the predicted common secondary structure (γ-centroid estimator) of the GluA2 and 3 pre-mRNA encompassing the R/G site for 10 vertebrate species (Supplementary Table S1 and Supplementary Figure S6) mapped onto the rat sequences. Base pairs are rendered according to the Leontis/Westhof (LW) nomenclature. The splice donor site (5′ SS) and editing sites are annotated in violet and red, respectively. Base positions are color-coded according to vertebrate sequence similarity (see color map), thus yellow base positions are completely conserved. Note the mismatch (1) and the longer loop sequence (2) distinguishing GluA2 from the GluA3 R/G editing substrate. Bottom: the consensus structure of the three rat paralogs of the GluA2–4 R/G editing substrates. Lilac highlight = exon sequence; salmon highlight = R/G site ECS. The putative binding sites of the two dsRBMs of Adar2 are illustrated with yellow circles. (B) Changes in R/G editing of GluA3 show regulation by an activity similar to GluA2, albeit to a lesser extent. The number at the base of each plot is the number of slices. The P-value is derived from the Kruskal–Wallis ANOVA test statistic and the asterices summarize the results of Dunn’s post-tests: **P < 0.01. (C) The abundance of GluA3 flip splice variant as a fraction of total subunit mRNA expressed in CA1 is plotted for the different drug treatments. Quantification of splice variants is determined from mean peak height ratios for the first alternatively spliced nucleotide positions. GluA3 flip/flop splicing is invariant across drug treatments. (D) The fold change in CA1 mRNA levels of Adar1 relative to the mean of intra-PCR run CTRL treatments is plotted (box and whisker) for the (48 h) drug treatments. Adar1 expression was normalized to the endogenous house keeping gene Gapdh. Adar1 expression was comparable between CTRL and TTX. The two-tailed P-value and asterisks are derived from the Mann–Whitney U-test statistic, P = ns.
Figure 5.
Figure 5.
GluA subunit RNA processing is expressed in a gradient across CA1. (A) Sequence traces of PCR-amplified GluA2 from acutely dissected CA1 segments (CA1-c, -b, -a) document a gradual reduction of the flip exon and R/G editing towards the subiculum. (B) Quantification of the peak heights from sequence chromatograms is summarized in line plots. The plot documents normalized levels of R/G editing for the GluA2 and GluA3 transcripts in acutely dissected CA1 (CA1-c to -a). Results are normalized to levels of R/G editing in CA1-c. (C) Line plot indicating a gradual change of flip/flop splicing for all three GluA paralogs in acutely dissected CA1. Results are normalized to levels of flip in CA1-c. (D) Line plot summarizing R/G editing (solid line) and i/o splicing (dashed line) data for CTRL (gray) and drug-treated, TTX (red), BIC (blue) organotypic slices. The left y-axis represents the percentage of R/G editing, the right y-axis represents percentage flip exon inclusion. (E) Schematic of a hippocampal slice, depicting the two major subfields, CA3 (purple) and CA1 (green). CA1 subsegments (CA1-c to -a) are indicated. As indicated, levels of flip and editing diminish toward the subiculum at the expense of flop.

Comment on

References

    1. Bass BL. RNA editing by adenosine deaminases that act on RNA. Annu. Rev. Biochem. 2002;71:817–846. - PMC - PubMed
    1. Jepson JE, Reenan RA. RNA editing in regulating gene expression in the brain. Biochim. Biophys. Acta. 2008;1779:459–470. - PubMed
    1. Hundley HA, Bass BL. ADAR editing in double-stranded UTRs and other noncoding RNA sequences. Trends Biochem. Sci. 2012;35:377–383. - PMC - PubMed
    1. Peng Z, Cheng Y, Tan BC, Kang L, Tian Z, Zhu Y, Zhang W, Liang Y, Hu X, Tan X, et al. Comprehensive analysis of RNA-Seq data reveals extensive RNA editing in a human transcriptome. Nat. Biotechnol. 2012;30:253–260. - PubMed
    1. Paul MS, Bass BL. Inosine exists in mRNA at tissue-specific levels and is most abundant in brain mRNA. EMBO J. 1998;17:1120–1127. - PMC - PubMed

Publication types